Download
1 / 15
150 likes | 266 Views
Short Breaks Activities for Disabled Children Supporting Families experiencing Financial Hardship. What percentages of disabled children live in, or on the margins of poverty? A 20% B 35% C 55%

E N D
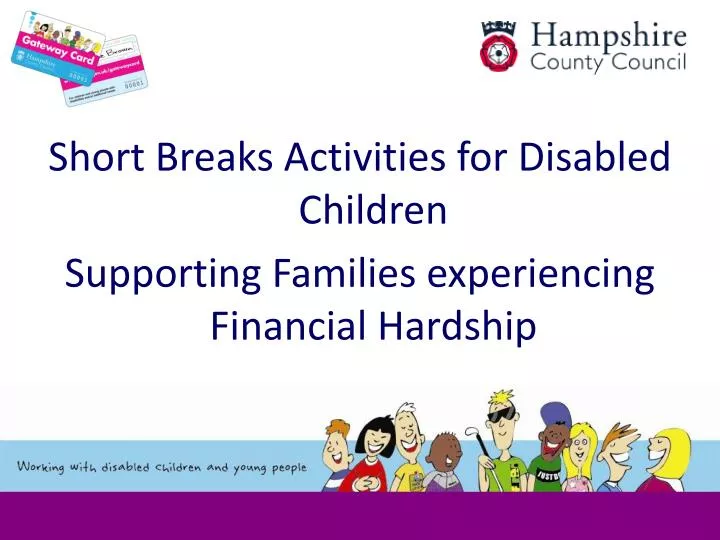
Short Breaks Activities for Disabled Children Supporting Families experiencing Financial Hardship
What percentages of disabled children live in, or on the margins of poverty? A 20% B 35% C 55% What percentage of families with disabled children are caring for more than one disabled child? A 4% B 10% C 2% Quiz
For parents WITHOUT children with disabilities 61% of mums, and 86% of dads are in paid work. What is the percentage for mums and dads WITH disabled children? MUMS A 16% B 26% C 56% DADS A 43% B 53% C 63% How much does it cost on average to raise a disabled child in comparison with a child with no disabilities? A 4 times as much B 3 times as much C twice as much Quiz
In the general population 22% of all families are lone parents. What percentage of families with disabled children are lone parents A 25% B 28% C 32% In 2006, what percentage of families with disabled children under 16, were receiving some level of Disability Living Allowance (DLA) – a non means tested benefit? A 50% B 25% C 82% Quiz
Out of every four families with a severely disabled child, how many might be living in unsuitable housing? A 3 B 2 C 1 Statistics collated from Contact A Family. Report ‘A Good Practice in Working with Parents of Disabled Children’ written by Carrie Britton and Kim Aumann of Amaze Research and Training Quiz
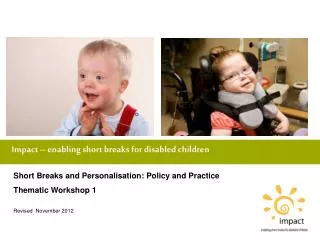
The programme is underpinned by the Short Breaks for Carers Regulations 2011. The Short Breaks Programme aims to ensure all families can access the scheme/activity whatever their circumstances The purpose of Short Breaks funding is to meet the additional costs that may arise due to a child’s disability and/or additional needs Important Principles of Short Breaks funding
Providers are expected to establish a reasonable contribution towards the cost of their activity and to state this clearly in Grant applications. The amount requested should take into account the cost of running the activity and be in line with other similar activities in the local area e.g a long distance trip to a Theme Park or a high cost activity (examples include horse riding and power boating) will have a higher contribution. In general, Short Breaks can fund a maximum of 50% of the entrance fees for an activity. Parental Contributions for Short Breaks activities
For mainstream and inclusive family activities: Parents of disabled children can be expected to pay the standard amount but no more. An example is where a child needs to attend individual or smaller group swimming lessons, the parents would pay the standard amount for a group lesson. Consider discounts for applications for more than one child. Parental Contributions for Short Breaks activities
“Some parents may need to approach you about paying a lower parental contribution. As a provider you will need to consider having a policy or similar arrangements to support these families. We would like providers to identify in their Grant applications any estimated costs for supporting families who may have difficulty affording the usual charge/contribution.” You will also need to consider the demographic of the local area you will be offering the service in when deciding how to plan for hardship provision For Grant applications,see the Short Breaks Guidance notes:
Further information on your local area “A Profile of Hampshire 2011” gives a useful outline of variations in Household Income across Hampshire www.hants.gov.uk/profile_of_hampshire_2011_final_version.pdf
The proportion of children living in households in receipt of out of work benefits, or where income is less than 60% of the national median average, varies significantly across Hampshire. Although the average for the county is 12.2% (2008/09), in some wards it reaches 40-50% Every district has a ward where over 10% of children live in low income/out of work households www.hants.gov.uk/child_poverty_needs_assessment_2011.pdf Child poverty in Hampshire
269 neighbourhoods (32.7% of the total) have levels higher than the Hampshire average The worst affected neighbourhoods are clustered in Havant, Gosport and the New Forest. The lowest incomes are in East Hampshire, Gosport, Eastleigh, Havant, the New Forest and Test Valley (2008/9) Child poverty in Hampshire
On your table, please discuss your thoughts on issues relating to hardship from both a parent and a providers perspective – be as specific as you can Write these thoughts clearly on a flip chart, leaving a space underneath each issue identified. Activity
Swap your flipchart paper with an adjacent group. Each group should then discuss working solutions to overcome the issues outlined on the flipchart paper they have just been given. These solutions need to be family focussed and should result in practical ways for using and accessing the hardship fund. Write these solutions in a different colour on the flipchart Activity- part 2