Download
1 / 16
160 likes | 284 Views
AFRICA HIV/AIDS AIDS DATA. SOURCE: UNAIDS 2007 REPORT WORLD HEALTH ORGANIZATION. A global view of HIV infection 33 million people [ 30–36 million ] living with HIV, 2007. 2.2. HIV prevalence (%) in adults in Africa, 2007. 2.8. Ghana. 1950. 2007. 100+. Male. Female. Male. Female.

E N D
AFRICAHIV/AIDS AIDS DATA SOURCE: UNAIDS 2007 REPORT WORLD HEALTH ORGANIZATION
A global view of HIV infection 33 million people [30–36 million] living with HIV, 2007 2.2
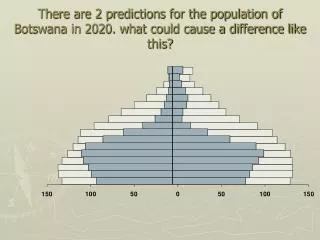
Ghana 1950 2007 100+ Male Female Male Female 80 60 Age 40 20 0 10 5 0 5 10 10 5 0 5 10 Percentage Percentage Lesotho 1950 2007 100+ Male Female Male Female 80 60 Age 40 20 0 10 5 0 5 10 10 5 0 5 10 Percentage Percentage Changes in population structure: Ghana and Lesotho Source: Population Division of the Department of Economic and Social Affairs of the United Nations Secretariat, World Population Prospects: The 2006 Revision, http://esa.un.org/unpp 2.12
FIRST OF 3 PARTS: Analysis of trends among 15–24-year-olds in high prevalence countries (all countries with national prevalence that exceeded 3% and 4 additional countries in Africa with notable prevalence levels): HIV prevalence among pregnant women (2000–2007) in sentinel surveillance systems, and selected sexual behaviours among women and men (1994–2007) from national surveys NOTES: [1] Highlighted cellsindicate positive trends in prevalence or behaviour. [2]* Consistent sites only were used in the analysis of change in HIV prevalence over time, for a minimum of three years. Significance test based on H0: slope =0 LEGEND: [a]Prevalence obtained from pregnant women attending antenatal clinics in selected. [b]Among 15–19 years olds, proportion reported having had sex by age 15. Analyses based on DHS, MICS or national surveys conducted between 1990 and 2007. [c]Among 15–24 years olds, proportion reported having had sex with more than one partner in the last 12 months. Analyses based on data from repeat DHS or national surveys conducted between 1990 and 2007. [d]Among 15–24 years olds, proportion of those with more than one partner reporting having used a condom the last time they had sex. Analyses based on data from repeat DHS or national surveys conducted between 1990 and 2007. [Ù]Observed increase in HIV prevalence or behaviour. [Ú]Observed decrease in HIV prevalence or behaviour. [Ú*]Statistically significant decrease in HIV prevalence of more than 25% or significant decrease in measured behavioural indicator. Analysis of prevalence based on regression analysis; analysis of behaviour based on Chi-square or Chi-square test for trend. [Ù*]Statistically significant increase in measured behavioural indicator. Analysis of behaviour based on Chi-square or Chi-square test for trend. [↔]No evidence of change. [ID]Insufficient data, i.e. less than three years of data received. 2a
SECOND OF 3 PARTS: Analysis of trends among 15–24-year-olds in high prevalence countries (all countries with national prevalence that exceeded 3% and 4 additional countries in Africa with notable prevalence levels): HIV prevalence among pregnant women (2000–2007) in sentinel surveillance systems, and selected sexual behaviours among women and men (1994–2007) from national surveys NOTES: [1] Highlighted cellsindicate positive trends in prevalence or behaviour. [2]* Consistent sites only were used in the analysis of change in HIV prevalence over time, for a minimum of three years. Significance test based on H0: slope =0 LEGEND: [a]Prevalence obtained from pregnant women attending antenatal clinics in selected. [b]Among 15–19 years olds, proportion reported having had sex by age 15. Analyses based on DHS, MICS or national surveys conducted between 1990 and 2007. [c]Among 15–24 years olds, proportion reported having had sex with more than one partner in the last 12 months. Analyses based on data from repeat DHS or national surveys conducted between 1990 and 2007. [d]Among 15–24 years olds, proportion of those with more than one partner reporting having used a condom the last time they had sex. Analyses based on data from repeat DHS or national surveys conducted between 1990 and 2007. [Ù]Observed increase in HIV prevalence or behaviour. [Ú]Observed decrease in HIV prevalence or behaviour. [Ú*]Statistically significant decrease in HIV prevalence of more than 25% or significant decrease in measured behavioural indicator. Analysis of prevalence based on regression analysis; analysis of behaviour based on Chi-square or Chi-square test for trend. [Ù*]Statistically significant increase in measured behavioural indicator. Analysis of behaviour based on Chi-square or Chi-square test for trend. [↔]No evidence of change. [e]Semi-urban and urban areas were combined in analysis of urban data. [f] Analysis in Mozambique combined for South, North and Central. 2b
LAST OF 3 PARTS: Analysis of trends among 15–24-year-olds in high prevalence countries (all countries with national prevalence that exceeded 3% and 4 additional countries in Africa with notable prevalence levels): HIV prevalence among pregnant women (2000–2007) in sentinel surveillance systems, and selected sexual behaviours among women and men (1994–2007) from national surveys NOTES: [1] Highlighted cellsindicate positive trends in prevalence or behaviour. [2]* Consistent sites only were used in the analysis of change in HIV prevalence over time, for a minimum of three years. Significance test based on H0: slope =0 LEGEND: [a]Prevalence obtained from pregnant women attending antenatal clinics in selected. [b]Among 15–19 years olds, proportion reported having had sex by age 15. Analyses based on DHS, MICS or national surveys conducted between 1990 and 2007. [c]Among 15–24 years olds, proportion reported having had sex with more than one partner in the last 12 months. Analyses based on data from repeat DHS or national surveys conducted between 1990 and 2007. [d]Among 15–24 years olds, proportion of those with more than one partner reporting having used a condom the last time they had sex. Analyses based on data from repeat DHS or national surveys conducted between 1990 and 2007. [Ù]Observed increase in HIV prevalence or behaviour. [Ú]Observed decrease in HIV prevalence or behaviour. [Ú*]Statistically significant decrease in HIV prevalence of more than 25% or significant decrease in measured behavioural indicator. Analysis of prevalence based on regression analysis; analysis of behaviour based on Chi-square or Chi-square test for trend. [Ù*]Statistically significant increase in measured behavioural indicator. Analysis of behaviour based on Chi-square or Chi-square test for trend. [↔]No evidence of change. [ID]Insufficient data, i.e. less than three years of data received. [ND] Data not received. [g]No data received in response to working group process; analyses based on data in South Africa surveillance report. [h]No data received in response to working group process; analyses based on data reported in Zambia 2005 surveillance report. Analysis based on urban and rural data combined. 2c
Estimated number of people living with HIV and adult HIV prevalence Global HIV epidemic, 1990–2007; and, HIV epidemic in Sub-Saharan Africa, 1990–2007 Global HIV epidemic, 1990–2007 HIV epidemic in Sub-Saharan Africa, 1990–2007 Number of people living with HIV (millions) % HIV prevalence, adult (15–49) Number of people living with HIV (millions) % HIV prevalence, adult (15–49) 40 4.0 30 15.0 25 12.0 30 3.0 20 9.0 20 2.0 15 6.0 10 10 1.0 3.0 5 0 0 0 0 1990 ‘91 ‘92 ‘93 ‘94 ‘95 ‘96 ‘97 ‘98 ‘99 2000 ‘01 ‘02 ‘03 ‘04 ‘05 ‘06 2007 1990 ‘91 ‘92 ‘93 ‘94 ‘95 ‘96 ‘97 ‘98 ‘99 2000 ‘01 ‘02 ‘03 ‘04 ‘05 ‘06 2007 NOTE: Even though the HIV prevalence stabilized in Sub-Saharan Africa, the actual number of people infected continues to grow because of ongoing new infections and increasing access to antiretroviral therapy. Number of people living with HIV % HIV prevalence, adult (15–49) These bars indicate the range around the estimate 2.3
70 Sub-Saharan Africa 60 GLOBAL 50 Percent female (%) Caribbean 40 Asia 30 Latin America 20 Eastern Europe & Central Asia 10 0 1990 ‘91 ‘92 ‘93 ‘94 ‘95 ‘96 ‘97 ‘98 ‘99 2000 ‘01 ‘02 ‘03 ‘04 ‘05 ‘06 2007 Percent of adults (15+) living with HIV who are female 1990–2007 2.4
Percentage of incident tuberculosis cases in people living with HIV receiving both antiretroviral and anti-tuberculosis medications, 2007 100 80 60 % 40 20 0 North Africa and Middle East (3) Oceania (2) Sub- Saharan Africa (22) GLOBAL (76) Caribbean (10) Latin America (14) Eastern Europe and Central Asia (12) South and South- East Asia (8) East Asia (12) Western and Central Europe (3) (total number of UN member states in the region) (Note: No data from North America) Source: UNGASS data provided by countries, 2008. 5.7
HIV-Related Labour Costs SECTOR COUNTRY NUMBER OF WORKERS IN SECTOR ESTIMATED HIV PREVALENCE (% of Adult Population) COST PER AIDS DEATHS OR RETIREMENT (Multiple of Annual Compensation) AGGREGATE ANNUAL COSTS (% of Labor Cost) Retail South Africa 500 10.50 0.7 0.50 Agribusiness South Africa 700 23.70 1.1 0.70 Uganda 500 5.60 1.9 1.20 Kenya 22,000 10.00 1.1 1.00 Zambia 1,200 28.50 0.9 1.30 Manufacturing South Africa 1,300 14.00 1.2 1.10 Uganda 300 14.40 1.2 1.90 Ethiopia 1,500 5.30 0.9 0.60 Ethiopia 1,300 6.20 0.8 0.60 Media South Africa 3,600 10.20 1.3 1.30 Utility South Africa >25,000 11.70 4.7 2.20 Mining South Africa 600 23.60 1.4 2.40 Botswana 500 29.00 4.4 8.40 Tourism Zambia 350 36.80 3.6 10.80 Source: Piot P et al. (2007). Squaring the Circle: AIDS, Poverty, and Human Development. 6.2
Orphans due to AIDS in Sub-Saharan Africa, from 2006 projected to 2015 16 14 Millions 12 10 8 6 AIDS orphans_base 4 AIDS orphans scaled phase-up AIDS orphans UA2010 2 0 2006 2007 2008 2009 2010 2011 2012 2013 2014 2015 Source: UNICEF, UNAIDS, WHO, 2008. 6.4