Download
1 / 24
250 likes | 423 Views
Genetic Population Structure of Chinook Salmon in the California Central Valley. Scott M. Blankenship, Christophe Lemaire, John Carlos Garza Southwest Fisheries Science Center Santa Cruz Laboratory. Outline. Objectives Background Population analysis Phylogenetic analysis

E N D
Genetic Population Structure of Chinook Salmon in the California Central Valley Scott M. Blankenship,Christophe Lemaire, John Carlos Garza Southwest Fisheries Science Center Santa Cruz Laboratory
Outline • Objectives • Background • Population analysis • Phylogenetic analysis • Individual assignment • Conclusions
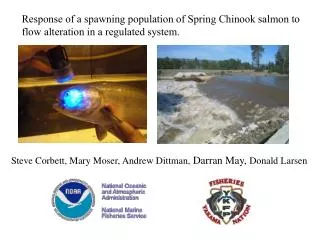
Objectives • Primary: Describe population structure and the distribution of • genetic variation for Central Valley chinook salmon • populations to help guide recovery and restoration • efforts. • Secondary: Create comprehensive database • Boundaries among populations • Geneflow • Effective population sizes • Demographic trajectory • Hatchery interactions Ecosystem Restoration Program - CALFED Goal 1: At-Risk Species
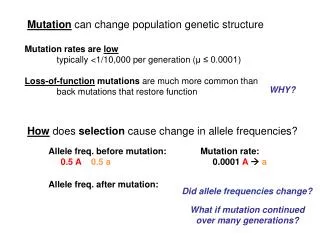
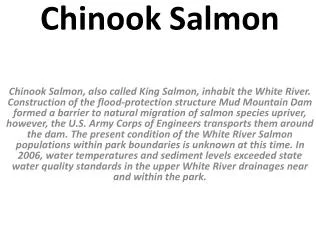
Background • Chinook salmon an important species • ecological – abundant component of ichthyofauna • scientific – most diverse life-history of Pacific Salmon • economic – major recreational and commercial fisheries • cultural – tribal fishery in coastal California. • Evolutionary Significant Units (ESU) • Fall/Late Fall • Spring • Winter
Background 1) Allele frequency differences 2) Trees 1 Pop 1 Pop 2 observed observed 2 Allele size Allele size Pop 3 Pop 4 3 observed observed 4 Allele size Allele size Population Comparisons
Background – Allozymes (protein markers) Interior Fraser Central British Columbia Upper Klamath Columbia spring Puget Sound Strait of Georgia Vancouver Is. WA coast OR coast CA Central Valley Columbia fall Lower Columbia coastal Klamath North CA coast Waples et al. Evolution 58(2), 2004
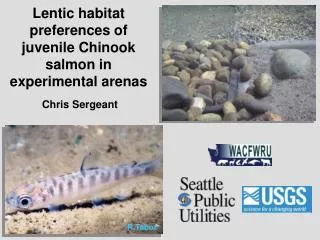
Background – Microsatellites (nuclear DNA) Winter Spring Butte Creek 100 Spring Deer & Mill Creeks 71 Fall 99 Late-fall 0.01 Banks et al. 2000 CJFAS 57:915
Sampling – California Dept. Fish and Game Sacramento River BY San Joaquin River BY 2002 2002 2002 2002 2002 2002 2002 2002 2003 2002 2002 2002 Battle Creek – fall Mill Creek – spring Mill Creek – fall Deer Creek – spring Deer Creek – fall Butte Creek – spring Butte Creek – fall Feather River – fall Feather Hatchery – spring Feather Hatchery – fall American River – fall Nimbus Hatchery – fall 2002 2002 2002 2002 2002 Mokelumne Hatchery – fall Stanislaus River – fall Toulumne River – fall Merced River – fall Merced Hatchery – fall Coastal California BY 2002 Klamath River – fall
Sampling – California Dept. Fish and Game Sacramento River N San Joaquin River N 100 57 79 83 34 96 96 78 65 69 53 100 Battle Creek – fall Mill Creek – spring Mill Creek – fall Deer Creek – spring Deer Creek – fall Butte Creek – spring Butte Creek – fall Feather River – fall Feather Hatchery – spring Feather Hatchery – fall American River – fall Nimbus Hatchery – fall 84 91 75 57 89 Mokelumne Hatchery – fall Stanislaus River – fall Toulumne River – fall Merced River – fall Merced Hatchery – fall Coastal California N 31 Klamath River – fall
Population Analysis – Within population Mean allele Richness Proportion LD HWC FIS Sample Battle Creek (f) Mill Creek (sp) Mill Creek (f) Deer Creek (sp) Deer Creek (f) Butte Creek (sp) Butte Creek (f) Feather River (f) Feather Hatchery (sp) Feather Hatchery (f) American River (f) Nimbus Hatchery (f) 9.88 9.28 10.06 9.63 10.22 8.72 10.50 10.55 10.32 9.85 10.45 10.36 10.48 10.16 10.25 10.42 8.62 Mokelumne Hatchery (f) Stanislaus River (f) Toulumne River (f) Merced River (f) Merced Hatchery (f) Klamath River (f)
Population Analysis – Within population (23 Loci) Expected Unbiased Heterozygosity vs. Allele Richness (23 loci) Mill (f) Deer (f) Butte (f) Battle (f) Mill (sp) Feath (f) Toulu (f) Mer H(f) Stanis (f) Deer (sp) Mokel (f) Butte (sp) Americ (f) Merced (f) Nimbus (f) Klamath(f) Feath H (f) FeathH(sp)
Population Analysis – Within population (23 Loci) No No No No No No No No No No No No No No No No No No 0.11*** 0.07*** 0.10*** 0.11*** 0.13*** 0.12*** 0.14*** 0.12*** 0.08** 0.10*** 0.14*** 0.08*** 0.08*** 0.13*** 0.05* 0.16*** 0.17*** 0.06 HWC equilibrium Mean allele Richness Proportion LD FIS Sample Battle Creek (f) Mill Creek (sp) Mill Creek (f) Deer Creek (sp) Deer Creek (f) Butte Creek (sp) Butte Creek (f) Feather River (f) Feather Hatchery (sp) Feather Hatchery (f) American River (f) Nimbus Hatchery (f) 9.88 9.28 10.06 9.63 10.22 8.72 10.50 10.55 10.32 9.85 10.45 10.36 10.48 10.16 10.25 10.42 8.62 0.04 0.11 0.05 0.09 0.05 0.07 0.04 0.04 0.04 0.06 0.04 0.06 0.04 0.09 0.05 0.07 0.04 0.11 Mokelumne Hatchery (f) Stanislaus River (f) Toulumne River (f) Merced River (f) Merced Hatchery (f) Klamath River (f)
Population Analysis – Among population (23 loci) Coastal CA Dataset Population Group FST1 FST1 Group Overall Wild (no Hatchery) Central Valley Wild Central Valley Within Spring Within Fall Within Hatcheries 0.022*** 0.024*** 0.017*** 0.017*** 0.020*** 0.015*** 0.015*** All Populations 0.056 Coastal 0.036 Central Valley 0.017 Mean Pairwise Population Group FST1 Hatchery Fall vs. Fall Hatchery vs. wild counterpart Spring vs. Fall Klamath vs. CV 0.018 0.018 0.030 0.082 1 Weir and Cockerham (1984)
Phylogenetic Analysis 0.01 Reynolds-distance Reynolds, Weir, and Cockerham's (1983) ButteS AmericanF FeatherHS MercedF BattleF FeatherF MillS DeerF DeerS MillF FeatherHF MokelumHF NimbusHF ButteCkF StanislsF ToulumneF KlamathF MercedHF
Phylogenetic Analysis Consensus Tree Reynolds-distance Reynolds, Weir, and Cockerham's (1983) 1000 Bootstraps Mill (sp) Deer (sp) Merced Hatchery (f) Toulumne (f) Klamath (f) Butte (sp) Stanislaus (f) Feather Hatchery (f) Feather Hatchery (sp) Butte (f) Feather (f) American (f) Mill (f) Merced (f) Battle (f) Mokelumne Hatchery (f) Deer (f) 100 Nimbus Hatchery (f)
Phylogenetic Analysis San Joaquin spring Consensus Tree Klamath (f) Merced Hatchery (f) 1000 Bootstraps 567 Toulumne (f) Stanislaus (f) Butte (f) American (f) Merced (f) Mokelumne Hatchery (f) Nimbus Hatchery (f) Deer (f) Battle (f) Mill (f) Feather (f) Feather Hatchery (sp) Butte (sp) 840 Deer (sp) 671 Mill (sp) 100 Feather Hatchery (f)
Phylogenetic Analysis Consensus Tree Klamath (f) Merced Hatchery (f) 1000 Bootstraps 567 Toulumne (f) Stanislaus (f) Butte (f) American (f) Merced (f) Mokelumne Hatchery (f) Nimbus Hatchery (f) Deer (f) Battle (f) Mill (f) Feather (f) Feather Hatchery (sp) Butte (sp) 840 Deer (sp) 671 Mill (sp) 100 Feather Hatchery (f)
Individual Assignment – ESU level ESU % Correct ESU % Correct Fall/Late Fall 98 Spring 69 Klamath 100 79 (excluding Feather Hatchery sp.) Klamath 99 Coastal CA 97
Individual Assignment – ESU level ESU % Correct ESU % Correct Lineage % Correct Fall/Late Fall 98 Spring 79 Klamath 100 Mill/Deer (sp) 72 Butte (sp) 84 Klamath 99 Coastal CA 97
Individual Assignment – Watershed level System % Correct Watershed % Correct 25 37 37 55 47 36 Battle Creek Mill Creek Deer Creek Butte Creek Feather River American River Sacramento River 78 San Joaquin River 65 Mokelumne River Stanislaus River Toulumne River Merced River 27 62 28 53
Individual Assignment – Watershed level Coastal CA Watershed % Correct Watershed % Correct 25 37 37 55 47 36 Battle Creek Mill Creek Deer Creek Butte Creek Feather River American River Klamath River Mad River Eel River Noyo River Wages Creek Russian River 97 86 94 88 100 83 Mokelumne River Stanislaus River Toulumne River Merced River 27 62 28 53
Individual Assignment – Population level Sacramento River San Joaquin River % Correct % Correct 25 52 21 51 04 84 36 17 35 34 15 33 Battle Creek – fall Mill Creek – spring Mill Creek – fall Deer Creek – spring Deer Creek – fall Butte Creek – spring Butte Creek – fall Feather River – fall Feather Hatchery – spring Feather Hatchery – fall American River – fall Nimbus Hatchery – fall 27 62 28 05 74 Mokelumne Hatchery – fall Stanislaus River – fall Toulumne River – fall Merced River – fall Merced Hatchery – fall Coastal California % Correct 100 Klamath River – fall
Conclusions • Genetic data show low differentiation among Central Valley • populations, and genetic distances are smaller than those of • other salmonid populations in California. • Population genetic data are consistent with ESU designations. • Genetic data indicate that run timing is more important than • geography for describing genetic structure. • Phylogenetic analysis suggests recent population radiation or • substantial recent geneflow. • Hatchery populations do not necessarily reflect their wild • counterparts, but are not extremely divergent.
Acknowledgements Laboratory Funding US Fish & Wildlife Service Southwest Fisheries Science Center Celeste Gallardo Amy Bouck Cheryl Dean Samples California Dept. Fish & Game Alice Low Randal Benthin Rich Dixon Jennifer Navicky