Download
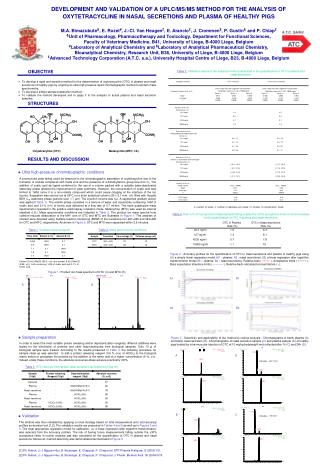
1 / 32
330 likes | 570 Views
Large-scale control of multiple tropical cyclone events in the western North Pacific Tim Li University of Hawaii. Gao, J., and T. Li, 2011: Factors controlling multiple tropical cyclone events in the western North Pacific, Monthly Weather Review, in press.

E N D
Large-scale control of multiple tropical cyclone events in the western North PacificTim Li University of Hawaii Gao, J., and T. Li, 2011: Factors controlling multiple tropical cyclone events in the western North Pacific, Monthly Weather Review, in press. Gao, J., and T. Li, 2011: Interannual variation of occurrence of multiple tropical cyclone events in the western North Pacific, AAS, submitted.
Examples of the MTC events Sept. 14 - 22, 1994 Sept. 10 -18, 1998
Physics behind the MTC events:1. MTC genesis associated with TC energy dispersion (Li et al. 2003) A: Jelawat B: Ewiniar 3-8 day filtered QuikSCAT surface wind fields
2. MTC genesis at a critical longitudinal zone (Kuo et al. 2001) Top: mean zonal wind (contour) and phase propagation vectors (arrows) and growth rates (shading) of the 8-day high-pass filtered 850 hPa vorticity in June-September (from Tam and Li 2006). Right: evolution of 8-day high-pass filtered surface winds from QickSCAT associated with an easterly wave (Fu, Li, et al. 2007)
3. MTC formation due to MJO forcing Top: Summer MJO variance (shaded) and MJO propagation vector Right: Intraseasonal OLR (bar, unit: W/m2) at each of TC genesis location and date in year 2000 and 2001. (from Fu, Li, et al. 2007)
Science Questions: • How to quantitatively define the multiple tropical cyclone (MTC) events? • What are large-scale factors that control the MTC formation in the WNP during boreal summer? • What determines the interannual variation of the summer MTC frequency?
Data and methodology: • Data: • NCEP OLR data (0.25o x 0.25o) • NCEP/DOE AMIP-II reanalysis daily data for 1979 - 2006 (1o x 1o) • JTWC TC best track data(Joint Typhoon Warming Center) • Methodology: • (1) Time-filtering (Lanczos) • To separate waves with different periods • 10-20-day band-pass filtering (BWO) • 25-70-day band-pass filtering (MJO/ISO) • (2) Composites • Based on MTC active and inactive phases and MTC active and inactive years • (3) Wavenumber-frequency analysis • To transform a field from a space-time domain to a wavenumber-frequency domain to illustrate dominant period, wavelength and propagation characteristics
MTC Definition ■ based on statistical characteristics of TCs in the WNP Average TC genesis interval: 5.76 days Standard deviation: 5.13 days Max TC genesis interval: 37 days Min TC genesis interval: 0 days
■(a) TC interval distribution of active MTC events ■(b) Period distribution of active MTC events
■The percentage of the MTC events as a function of the TC spatial distance
Active MTC events (green bar) and associated TC genesis dates (red line)
Observational Analysis I - Phase Composite (a) 850-hPa wind field (ms-1 vector) and vorticity (10-6s-1 contour) (b) OLR (Wm-2) (c) 500-hPa relative humidity (%) Difference between MTC active and inactive phases Shading: over the 95% confidence level
■BWO and ISO activity associated with active and inactive MTC phases active inactive difference Shading in the bottom panel: greater than a 95% confidence level
Difference of accumulated synoptic-scale (3-10-day) OLR between active and inactive MTC phases This implies that upscale feedback of the MTC events to the mean state is relatively weak. To the first order, it is the mean flow (including low-frequency variability) that modulates the MTC formation.
Percentage of occurrence of the MTC events in the TC genesis locations where BWO, ISO and/or LFO are in a wet phase
Conclusion (based on phase composite) ■The composite analysis reveals that the active MTC phase is associated with the enhanced low-level cyclonic and upper-level anticyclonic vorticity, enhanced monsoon convection, and the increase of mid-tropospheric relative humidity over SCS and WNP. An opposite pattern appears in the inactive MTC phase. ■ The occurrence of the summer MTC events is greatly regulated by the atmospheric biweekly and intraseasonal oscillations. It is found that about three quarters of individual MTC events occur in the region where either BWO or ISO is in a wet phase. On the other hand, the averaged synoptic-scale OLR value during the active MTC phase in the WNP is not significantly greater than that during the inactive MTC phase. The results suggest that the atmospheric low-frequency oscillations including BWO and ISO may modify the large-scale circulation in such a way that they create a favorable environmental condition for MTC genesis.
Observational Analysis II – Interannual Variability ■List of MTC active and inactive years
■TC genesis locations associated with all MTC events during the seven active (top panel) and seven inactive (bottom panel) MTC years. Different symbols represent TC locations in different years.
Average MTC number (from June to October) between active (white bar) and inactive (gray bar) MTC years
Composite SST difference patterns between active and inactive MTC years • DJF (b) MAM (c) JJA (d) SON
ERSST.v3b SST anomalies in the Niño 3.4 region (5N-5S, 120-170W) during 7 active and 7 inactive MTC years
850-hPa wind (ms-1 vector) and vorticity (10-6s-1 contour) (b) 925-hPa divergence (10-6s-1 contour) (c) OLR (Wm-2) ■ Composite differences between active and inactive MTC years in June-October. ■ Shading indicates the area exceeding 95% (darker color) and 90% (lighter color) confidence levels.
ISO intensity composites for active and inactive MTC years active inactive difference
Energy spectrum of eastward- and westward-propagating ISO MTC active years MTC inactive years Difference
Energy spectrum of northward-propagating ISO MTC active years MTC inactive years Difference
Scatter diagram between the number of MTC events and the northward-propagating ISO intensity index (triangles, with a red solid line denoting its linear trend) and the westward-propagating ISO intensity index (squares, with a blue dashed line denoting its linear trend) each year during 1979-2006.
Conclusion (interannual variation) ■Compared to the inactive MTC years, TC genesis locations during the active MTC years are extended further to the east and to the north. The maximum difference of average MTC frequency between the MTC active and inactive years occurs in June, August and September. ■The active MTC years are associated with the cold SST anomalies in the equatorial central-eastern Pacific and warm SST anomalies in the WNP in the preceding winter. As the season progresses from the winter to the concurrent summer, the central Pacific SST transitions from a cold anomaly to a warm anomaly, whereas the warm SST anomalies in the WNP persist and shift slightly eastward. This SST evolution characteristic resembles a typical ENSO decaying phase. Associated with this SST evolution are enhanced low-level cyclonic and upper-level anticyclonic vorticity and strengthened large-scale convection along the WNP monsoon trough. An opposite pattern appears during the inactive MTC years.
Conclusion (cont.) ■In addition to the summer mean flow, significant differences are found in the ISO strength. Compared to MTC inactive years, ISO convective activity is greatly strengthened in the WNP during the active MTC years. Both the ISO westward propagation and the northward propagation over the WNP are strengthened (weakened) during the MTC active (inactive) years. The enhanced mean monsoon trough and the strengthened ISO activity set up favorable environmental conditions for the MTC formation.
Correlation of summer MTC frequency with mean 850-hPa vorticity, OLR and 500-hPa relative humidity and with the ISO and BWO intensity 850-hPa vorticity OLR 500-hPa relative humidity (a)Seasonal mean (b)ISO intensity (c)BWO intensity Shading indicates the area exceeding the 95% (darker color) and 90% (lighter color) confidence level.
Composite differences of (a) ISO intensity, (b) BWO intensity, and (c) the combined ISO/BWO intensity between active and inactive MTC years. • ISO intensity • BWO intensity • (c) ISO+BWO intensity
(a) 850-hPa wind (ms-1 vector) and vorticity (10-6s-1 contour) (b) ISO intensity (unit: W/m2) (c) Energy spectrum of the zonal propagating BSISO ■ Composite differences between MTC active and inactive years during Jun-Oct ■ Shading indicates the area exceeding the 95% (darker color) and 90% (lighter color) confidence levels.