Download
1 / 17
190 likes | 524 Views
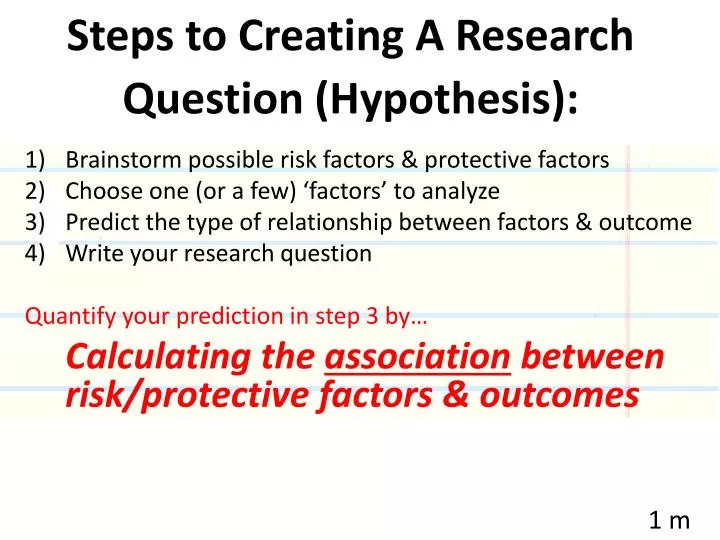
Steps to Creating A Research Question (Hypothesis):. Brainstorm possible risk factors & protective factors Choose one (or a few) ‘factors’ to analyze Predict the type of relationship between factor s & outcome Write your research question Quantify your prediction in step 3 by…

E N D
Steps to Creating A Research Question (Hypothesis): • Brainstorm possible risk factors & protective factors • Choose one (or a few) ‘factors’ to analyze • Predict the type of relationship between factors & outcome • Write your research question Quantify your prediction in step 3 by… Calculating the association between risk/protective factors & outcomes 1 m
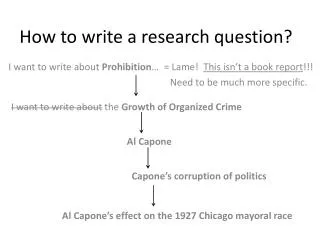
Step 3: Predict the type of relationship between factor and outcome Does _____________ cause _____________? (Risk Factor) (Outcome) Remember why we try to avoid this word? Today’s example: Does not getting a vaccine cause influenza? 1 min
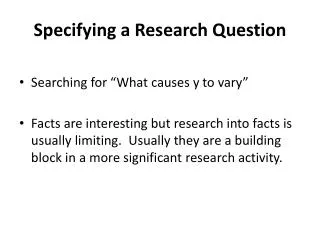
(Outcome) Is _____________ associatedwith _____________? (Risk Factor) • To figure this out we can compare incidence rates for people who: • Have or Do not have the Risk Factor • Have or Do not have the Outcome • For example: • Is not getting vaccinated associated with getting the flu? • We’ll us a 2x2 Contingency Table to sort all this out! 2m
(Outcome) Is _____________ associatedwith _____________? (Risk Factor) What goes into the 2x2 table? We just collect data on people based on RF & outcome. • Who had the FLU in the past year? • FLU: Go to the back of the room • NO FLU: Go to the front of the room • Who got a FLU SHOT in the past year? • FLU SHOT: Go to the door side corner • NO FLU SHOT: Go to the window side corner
2 x 2 Contingency Table After the population is sampled (like we just did), we add the values into the table: • Flu shot/Flu(a) • Flu shot/No Flu(b) • No Flu shot/Flu(c) • No Flu shot/No Flu (d) Outcome Variable Risk Factor Variable 3m
2 x 2 Contingency Table Let’s crunch some numbers! Outcome Variable Risk Factor Variable 2m
Our big goal? Find RELATIVE RISK! Relative Risk (RR):A ratio of the probability of the outcome occurring in the exposed (risk factor) group versus a non-exposed (no risk factor) group. RF No RF 1m
Review: What is Incidence? • What does it mean? • New cases of OUTCOME (flu) in population over time • Doesn’t tell us anything about RF (flu shot) on it’s own • So we must compare 2 groups’ Incidence rates to learn how the flu shot might be linked to flu • What is the formula? • Look back at your notes! TIME cancels when we divide a fraction by a fraction because it is the same for the RF & NO RF group!
Calculating Relative Risk If the incidence of the flu in the not vaccinated subpopulation is different from the incidence of theflu in thevaccinated subpopulation, then vaccinationand getting the flu are observed to beASSOCIATED. Outcome Variable Risk Factor Variable 1m
Calculating Relative Risk Step 1: Focus on the risk factor row. Remember, not vaccinated is our risk factor. Step 2: Calculate the incidence rate of the flu for those who are not vaccinated incidence rate = Outcome Variable Risk Factor Variable 3m
Calculating Relative Risk Step 3: Focus on: no risk factor row. Remember, vaccinatedis our no risk factor group. Step 4: Calculate the incidence rate of the flu for those who are vaccinated incidence rate = Outcome Variable Risk Factor Variable 2m
What does my RR value mean? RR = 7.0? There is a VERY strongassociation (7x) • The RF group is 7 times as likely to experience the outcome. RR = 1? There is no association. • The incidence in the RF group and no RF group were the same. RR = 1.5? There is a strong association (1.5x) • The risk factor group is 1.5 times as likely to experience the outcome. (50% more likely) RR = 1.1? There is some association (1.1x) • The risk factor group is 1.1 times as likely to experience the outcome. (10% more likely) RR = 0.9? There is ainverse association • Exposure to risk factor decreases the risk of the outcome by 10% 3 m
Focus on the decimal when RR is 1.0 – 1.99 RR = 1.04 .04 = 4% The RF group has 4% greater chance of experiencing outcome
Setting Up Your 2x2 Table Our goal: Get RR ≥ 1. So we need the TOP to be larger than the bottom. The top should represent: NEGATIVERISK FACTOR & BADOUTCOME BAD NEGATIVE
Group Practice BAD NEGATIVE 10-15 m
(Outcome) Is _____________ associatedwith _____________? (Risk Factor) • What are we trying to prove by calculating the association (by getting a RR value)? • That the RF & outcome are RELATED or LINKED, not that there is a DIRECT CAUSE relationship • What other factor might people who get the flu shot and don’t get the flu have in common? • Health-conscious? • Hand-washers? • Less exposed to contagious environments? • More access to health care? 2m