Download
1 / 26
260 likes | 382 Views
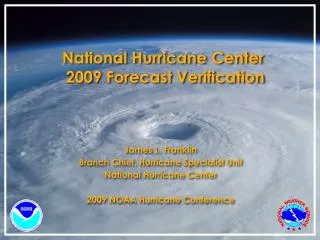
National Hurricane Center 2009 Forecast Verification. James L. Franklin Branch Chief, Hurricane Specialist Unit National Hurricane Center 2010 Interdepartmental Hurricane Conference. 2009 Atlantic Verification. VT NT TRACK INT ( h ) ( n mi) (kt)

E N D
National Hurricane Center 2009 Forecast Verification James L. Franklin Branch Chief, Hurricane Specialist Unit National Hurricane Center 2010 Interdepartmental Hurricane Conference
2009 Atlantic Verification VT NT TRACK INT (h) (n mi) (kt) ============================ 000 144 9.6 1.6 012 120 30.1 6.4 024 96 44.5 11.4 036 75 61.8 14.9 048 61 73.2 17.5 072 49 119.2 20.6 096 38 197.9 19.5 120 22 292.3 16.6 Four- and five day track error was almost exclusively along-track (slow). Sample was very small (last year 346 forecasts), and five-day sample is the smallest ever. • Values in green exceed all-time records. • GPRA track measure (48 h error for TS/H only) was 70.1 n mi, well below previous record of 86.2 and goal of 108 n mi. • GPRA intensity measure (48 h error for all TCs) was 17.5 kt, well above goal of 13 kt.
Atlantic Track Errors by Storm Bill and Ida accounted for nearly all of the 120-h forecasts.
Atlantic Track Errors vs. 5-Year Mean Official forecast was mostly better than the 5-year mean, even though the season’s storms were “harder” than normal.
Atlantic Track Error Trends Errors have been cut in half over the past 15 years. 2009 was best year ever at 24-72h. Smaller samples give more erratic trends at days 4-5.
Atlantic Track Skill Trends 2009 set skill records at 24-72 h. Sharp increase over past two years perhaps due to greater availability of the ECMWF (inclusion in TVCN).
2009 Track Guidance Official forecast performance was very close to the consensus models. Good year for FSSE. First year of availability for CMCI. Competitive, and potentially better than that (small sample). Best dynamical models were ECMWF and GFS. UKMET and NOGAPS have been consistently weaker performers over the past few years. BAMD performed poorly (strong shear). GFNI had insufficient availability.
48-h Model Trends UKMET, NOGAPS consistently trail the other models. Over 2007-9, UKMET helped the TVCN consensus, while NOGAPS degraded it.
2009 Consensus Guidance FSSE was the best consensus model in 2009. TVCN (with GFNI and EMXI) did better than TCON. Corrected consensus models TCCN, TVCN, CGUN did not do as well as their uncorrected counterparts. This was also true in 2008
GFS Ensemble Mean GFS low-res ensemble mean does not perform as well as the hi-res deterministic run, except at (and perhaps beyond) five days.
Atlantic Intensity Errors vs. 5-Year Mean OFCL errors in 2009 were mostly at or above the 5-yr means, but the 2009 Decay-SHIFOR errors were above their 5-yr means, indicating storms with unusual behaviors (OCD5 explains 55% of the variance in annual average OFCL error).
Atlantic Intensity Error Trends No progress with intensity.
Atlantic Intensity Skill Trends Little net change in skill over the past several years, although skill has been higher in this decade compared to the 90s.
2009 Intensity Guidance Best model at every time period was statistical. Outstanding year for LGEM, which handles changes in the environment better than SHIPS. Official forecast offers value over the guidance early, but less so later in the forecast period. This was true in 2008 as well. May pay to stay closer to guidance (especially ICON) at the longer ranges.
Genesis Forecasts Forecasts over three years were very well calibrated (reliable) with minimal bias. Refinement distribution shows how often the forecasts deviated from (perceived) climatology. Sharp peaks at climatology indicate low confidence; maxima at the extremes indicate high confidence. Current distribution indicates intermediate confidence.
2009 East Pacific Verification VT NT TRACK INT (h) (n mi) (kt) ============================ 000 268 9.7 1.7 012 236 29.5 7.1 024 204 50.9 12.8 036 173 71.9 17.1 048 143 89.0 18.0 072 99 119.2 17.3 096 69 162.5 18.1 120 45 240.4 18.8 Values in green tied or exceeded all-time lows.
Eastern Pacific Track Errors vs. 5-Year Mean Official forecast were very close to the 5-yr mean, even though the season’s storms were “harder” than normal. SW bias at days 4-5.
EPAC Track Error Trends Since 1990, track errors have decreased by 30%-50%.
EPAC Track Skill Trends Although errors were higher in 2009, skill was mixed.
2009 Track Guidance Official forecast performance was very close to the TVCN consensus model. OFCL beat TVCN at 12 and 72 h. EMXI best individual model. BAMD did about as well as any of the other 3-D models. HWFI competitive with GFDL (neither was outstanding).
2009 Consensus Guidance TVCN slightly better than FSSE. Single-model ensemble not nearly as effective as multi-model ensemble. Corrected consensus model TVCN did not do as well as its uncorrected counterpart.
EPAC Intensity Errors vs. 5-Year Mean OFCL errors in 2009 largely tracked their corresponding Decay-SHIFOR5 errors. (OCD5 errors above normal 12-48 h, and OFCL errors were also above normal.)
EPAC Intensity Error Trends Errors look pretty flat.
EPAC Intensity Skill Trends Skill also seems flat in this decade.
2009 Intensity Guidance Best model at every time period was statistical (DSHP or LGEM). Dynamical models did not have skill (but still contributed positively to the consensus). Skill levels much lower than for the Atlantic, but similar to last year. Official forecast offers value over the guidance early, but not so later in the forecast period. Large high bias at 120 h (last year there was a large low bias). This is consistent with strong southwest track bias.
Genesis Forecasts Forecasts have a pronounced low bias, even though we’ve been aware of it for the past two seasons. Refinement distribution shows a somewhat greater willingness to forecast higher percentages than in the Atlantic, but are certainly not high in confidence.