Download
1 / 18
180 likes | 310 Views
Monthly Averages of Aerosol Properties. J. Feichter U. Lohmann M. Schulz S. Ghan R. Easter M. Chin P. Ginoux T. Takemura. S. Ghan I. Tegen D. Koch M. Herzog J. Penner G. Pitari W. Collins P. Rasch. B. Holben T. Eck A. Smirnov O. Dubovik I. Slutsker. O. Torres I. Geogdzhayev

E N D
Monthly Averages of Aerosol Properties J. Feichter U. Lohmann M. Schulz S. Ghan R. Easter M. Chin P. Ginoux T. Takemura S. Ghan I. Tegen D. Koch M. Herzog J. Penner G. Pitari W. Collins P. Rasch B. Holben T. Eck A. Smirnov O. Dubovik I. Slutsker O. Torres I. Geogdzhayev M. Mishchenko L. Stowe A. Goulomb D. Tanre A. Chu Y. Kaufman A global comparison among Models, Satellite retrievals and AERONET ground data S.Kinne
Climate Research and AEROSOL AEROSOL has • one of the largest uncertainties in climate research • very low level of scientific understanding • even the sign of its climatic effect is in question
Why these uncertainties • Measurements ‘fail’ on global and long-temporal scales • sparse sampling rate nature of measurements • aerosol signals are often too small (natural variability?) • no distinction between natural and anthropogenic contributions • still needed to establish a framework for model-assumptions • Modeling ‘works’ always • but ... how well is aerosol characterized or processed ? • but ... how well are feedbacks accounted for?
New Aerosol Climate Modeling modeling of aerosol climatic impacts is done • at coarse resolution (ca 30x30) • in many individual steps • individually by aerosol type a many processes a possibilities for errors a Lets look at aerosol optical depth
Aerosol Optical depth of visible light • Cloud-free attenuation of visible sunlight due to • Scattering (minus scattering on air-molecules)and • Absorption (minus absorption by gases, mainly ozone) • easily imaginable (clarity of the sun’s disk) • measured from the ground (‘directly’ or ‘total-diffuse’) • commonly retrieved from cloud-free satellite-scenes • an integral parameter in forcing simulations (‘Step 3’) • Comparisons based on monthly statistics focus on: • Strength • Patterns • Seasonality
DATA Name Method Simulation Authors • MODIS (.44/.67/1.6/2.2mm) refl (2001) Chu /Remer /Kaufman /Tanre • AVHRR (.63/.83mm) refl. (1985-1988) Geogdzhayev /Mishchenko (.63mm) reflectance (1985-1988) Stowe • TOMS (.34/.38mm) refl. diff (1979-2000) Torres /Herman • POLDER (.67/.87mm) pol./refl. (11/96-6/97) Tanre /Goulomb • AERONET (.44/.87mm) attenu. (1994-2002) Holben /Eck /Smirnov • All data-sets are ‘normalized to .55mm wavelength • Resolution of all data-sets is degraded to 10*10 horizontal resolution • Concerns • MODIS: model, aerosol shape, limited land-coverage • AVHRR: model, ocean-limited, calibration, clouds • TOMS: model, height, cloud-contamination (50km pixel size) • POLDER: model, aerosol shape, larger sizes, clouds, no entire year • AERONET: regional representation, cirrus clouds
AERONET • worldwide network of robotic sun/sky-photometers • supervised and maintained at NASA-Goddard, USA • spectral bands: .34, .38, .44, .50, .67, .87, .94, 1.02mm • sample maximum 1/hr (sky-mode), 4/hr (sun-mode) • retrieved aerosol properties • optical depth • Angstrom parameter • size-distribution (22 bins from .5-15mm) • refractive index a (ss-albedo) • non-sphericity For retrieved aerosol properties beyond optical depth see poster: “Seasonal Aerosol Properties and Forcing - A global view based on AERONET statistics”
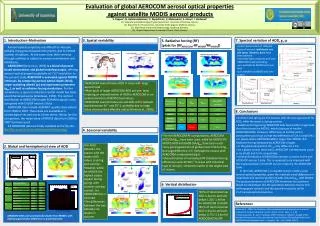
Data • retrieval model has an impact (‘AV’ vs ‘AVn’) • low ocean aot of MODIS suggest cloud contamination of coarser pixel retrievals • aot retrievals over land are difficult (+few) • more similarity in (aot) pattern than in amount
Satellite vs. Ground • agreement for aot-patterns • satellite land-aot often too high IMPROVE (USA): Extinction at ground is stronger in Eastern USA AERONET A satellite composite: MODIS (ocean), TOMS (Iand)
MODELS Name Resolution Simulation Authors • ECHAM4 (GCM) 3.8/3.8deg 50yr avg Feichter / Lohmann / Schulz • MIRAGE (GC/CTM) 2.8/2.8deg (6/94-5/95) Ghan / Easter • GISS (GCM) 4.0/5.0deg 3yr avg Koch / Tegen • GOCART (CTM) 2.0/2.5deg (90, 96, 97) Chin / Ginoux • CCSR (CTM) 2.8/2.8deg (90) Takemura / Nakajima • Grantour (GCM) 5.0/5.0deg 1yr avg Herzog / Penner • ULAQ (GCM) 10/22.5deg 5yr avg Pitari • HadHAM (GCM) 2.5/3.8deg 5yr avg Roberts / Jones • NCAR (GC/CTM) 1.9/1.8deg (95-00) Collins / Rasch • separate treatment of these 5 aerosol types: • sulfate, organic carbon, black carbon, dust, sea-salt
Models • Initial Impression • Similarities for patterns • Differences • in strength • for yearly average (left) • for season range (right) UL ULAQ GI GISS GO GOCART GR Grantour EC ECHAM4-old CC CCSR MI MIRAGE GO6 Gocart’96 GO7 Gocart’97 HA HadHam (no oc/ water) MP ECHAM4-new NC NCAR no aerosol water
AERONET Models • variations due to simulations for different years are small compared to model-differences • source aot-patterns agree better than source aot-amount • transport / removal strength often differ • different sensitivity to high relative hum (at higher latitudes) • comparison to data have (are) improving models (eg. EC a MP) • some differences are better understood on component level no aerosol water
Relative Model Tendencies • ECHAM4 strong bc-, du- seasonality, rh-sensitivity, low bc MEE • GOCART strong oc-, bc- seasonality, strong su-, du -transport, ss • MIRAGE strong su mass and transport, weak du, high lat. bias • GISS low mass (except su), strong du MEE, strong su transport • CCSR strong oc-, bc-, du- seasonality (+ sources), weak transport • Grantour lowest oc/bc -mass ratios, strong ss • ULAQ strongest su-, oc- sources, weak transport (especially bc) • NCAR weak aot for oc, bc and ss • HadHam strong su- seasonality, weak bc (mass and aot)
Models vs. Data • aot-patterns are similar • ‘preferred’ component of models have: large du sources (NC,GO) more transport (GO,GI) more ‘remote’ aot (Gr,GO)
Is there a BEST model ? • NO, not a particular model … but based on strength / pattern / seasonality comparisons • some components are treated better than others …thus • some models appear at least in part better than others To get a better impression please stop by at the posters: • “Monthly averages of aerosol properties - global fields for aerosol optical depth [model vs. measurements]” • “Simulated aerosol components- global fields of yearly averages and range of monthly means” These two posters also make a case for more action
Data Needs • VOLUME (more data) • global or (at least) multi-regional - especially over land • seasonal and time-sequentially • INTEGRATION(necessity to link different data-sets) • remote sensing from the ground • Passive (e.g. AERONET, MFRSR, BB-fluxes) • Active (e.g. Earlinet Lidar) • satellite data from space • MODIS, SeaWifs, TOMS, AVHRR, ATSR2 (more land data!) • field experiments • focus on aerosol type or mix (TARFOX, ACE-III, SCAR-B) • sample analysis • composition / absorption (Lab, filters)
Model Needs • IMPROVE AEROSOL PHYSICS • more aerosol components • better aerosol size representation • internal mixing • better chemistry • MORE FOCUSED COMPARISONS • use identical emission data • similar (nudged) meteorological • test agreement on derived near surface winds • distinguish properties by altitude (PBL, 2-5km, >5km) • OUTPUTS • reduce output to subsets that match less frequent data • reduce output to clear-sky data what improvements have the strongest impact? what are the reasons for model differences? what defines ‘clear-sky’ in models ?
Model Intercomparison Meeting • Date: tomorrow, Friday 20.Sept. • Time: 18.30 • Location: small room NORTH of reception hall • Topic: “Future steps in the evaluation of aerosol modules in GCM” • Hosts: Michael Schulz, Stefan Kinne …and on a final note: Your aerosol data-set (model or measurement) may have not be mentioned or included. If your data-set is available and can contribute in the evaluation of global models, please talk to me or send an e-mail to kinne@dkrz.de