Download
1 / 31
310 likes | 403 Views
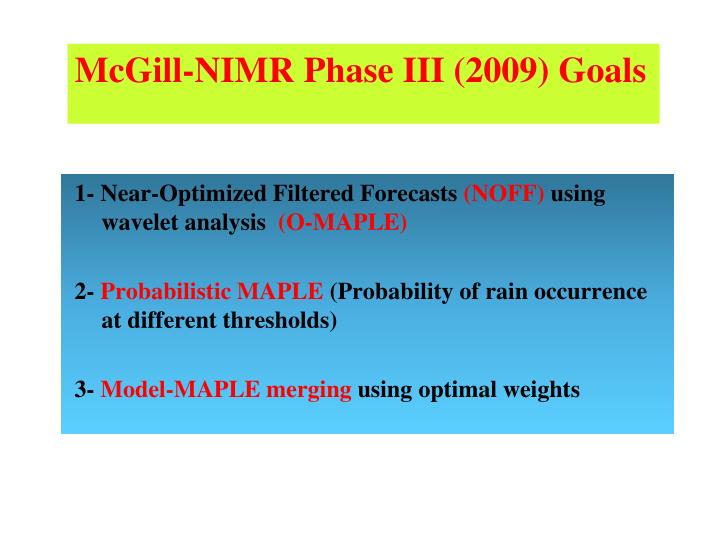
McGill-NIMR Phase III (2009) Goals. 1- Near-Optimized Filtered Forecasts (NOFF) using wavelet analysis (O-MAPLE) 2- Probabilistic MAPLE (Probability of rain occurrence at different thresholds) 3- Model-MAPLE merging using optimal weights. Summary of Phase I & II

E N D
McGill-NIMR Phase III (2009) Goals 1- Near-Optimized Filtered Forecasts (NOFF) using wavelet analysis (O-MAPLE) 2- Probabilistic MAPLE (Probability of rain occurrence at different thresholds) 3- Model-MAPLE merging using optimal weights
Summary of Phase I & II 1- Adaptation of the McGill Variational Echo Tracking (VET) algorithm to Korea radar composites 2- Nowcasting algorithm using the Semi-Lagrangian advection scheme based on the VET motion field 3- Verification in terms of CSI, POD, FAR, ETS, Cross-correlation and RMS using a 4-month data set 4- Sensitivity tests (vector density, dBZ threshold, time interval, weights for smoothing and conservation of reflectivity constraints) to determine the optimum VET input parameters
Verification results in terms of CSI obtained from the 4-month data sample. Reveals the poor forecastibilityof higher rainfall rates with time Ex: CSI (10 mm/h) < 20% for forecasts > 1 hour Conclusion: remove the unpredictable scales by optimal smoothing of the rainfall field with time.
Near-Optimized Filtered ForecastsTurner et al. JAM (2004) - Wavelength length scale Lw = 2m∆x for 0 ≤ m ≤ mmaxand ∆x=grid length - Wavelet spectrum S(m): Normalized difference between pairs of points Lw apart on the same map. - The wavelet cospectrum Co(m) involves different maps . - A map can be reconstructed as the sum, over all scales, of the product of the wavelet transform coefficients with the corresponding wavelet smoothed image. - Optimum weights w(m,T) that optimally dampen the features of scale m so as to minimize the errors between the forecast and the observation map at time T: w(m,T) =Cofo(m)/Sf(m) OFF filters where Cofo is the cospectrum between the forecast and observed maps and Sf(m) is the spectrum of the forecast map. - Nearly optimum (NOFF) weightscan be derived in real-time from the OFF weights of a previous forecast, (1 h), and then applying the known spatial-time interdependence, that is, w(L,T) = w (2L,2T)
Left, composite map at T0, (0500 KST 1-July-2006), and the 20-min, 1-h, 2-h, 3-h and 4-h “regular” forecasts • Right, the corresponding “filtered” NOFF forecasts with mmax=8 T0 map at 0500 KST 1-July-2006 20-min
1-h 2-h
3-h 4-h
mmax=7 mmax=8 Boundary artefacts mmax=5 mmax=6 Boundary artefacts on 4-h forecasts with large mmax reduced or eliminated with smaller mmax
mmax=6 mmax=8 1-h mmax=8 mmax=6 2-h Comparison of NOFF forecasts generated with mmax=8 with those generated with mmax=6
mmax=6 mmax=8 3-h mmax=8 mmax=6 4-h Comparison of NOFF forecasts generated with mmax=8 with those generated with mmax=6
As expected, the NOFF forecasts yield better scores in terms of ADIF, RMS and of the cross-correlation coefficient . (4-month data sample: July & Nov. ’06, Feb & May ‘07)
Surprisingly, unlike the results of Turner et al. (2004) with U.S. data, NOFF forecasts showed a significant improvement in terms of also the CSI parameter.
Probability Forecasts - Because of the combined uncertainty of the forecast displacement and, especially, of the evolution of the reflectivity field, nowcasting cannot produce accurate, deterministic forecasts for higher rainfall rates or for long periods of time. - Filtered forecasts is an honest response to this limitation but may not satisfy some end-users because the precipitation structure is gradually removed with lead time. Solution: Probability forecasts complement the “regular ” and the “NOFF” forecasts by indicating the probability of observing a precipitation rate above a few selected thresholds. The area A = L2over which the probability is computed increases with lead time T according to the space-time slope relationship L (km) = T(min) (L is limited to 160 km)
Left, composite map at T0, (0500 KST 1-July-2006), and the 20-min, 1-h, 2-h, 3-h and 4-h “regular” forecasts • Right, the corresponding “combo probability” maps derived from the reflectivity distribution over an area A=L2 such that L(km)=T(min), T being the forecast length in minutes. T0 map at 0500 KST 1-July-2006 20-min
1-h 2-h
3-h 4-h
Probability forecasts generated using the space-time relationship L = T0.8. No upper limit needs to be imposed on L because L=80 km for a 4-h forecast
Merging of Radar data with NWP output Radar nowcasts have better skill initially as they assimilate the precipitation field, but lose skill as storm evolution is not considered in the Lagrangian advection. NWP precipitation forecasts perform poorly initially as the precipitation field is not well captured but are better in the longer term as they capture storm evolution. Could ENSEMBLES of radar and NWP forecasts provide better forecasts by compensating for each other’s shortcomings ? What is the optimum algorithm for combining the radar nowcasts and NWP forecasts ? CSI Forecast time (hr)
Basic NWP-RADAR Merging Technique(Kilambi & Zawadzki, 2005, 32nd Radar Conf) - Determine the climatological skill of NWP forecasts and of radar nowcasts - For scores like CSI where increasing magnitude implies an increase in skill, let the weight for a given forecast method m, (RADAR or NWP), and for a lead time t be Wm,t = [1/(1-(CSIm,t)p)]-1 where the exponent p =2.5 magnifies the difference between the two methods. Ex: CSI ratio of (0.6/0.4) yields a weight ratio of 3.45 to 1. - The combined value is the weighted average of the NWP and RADar estimates: =[NWP*Wnwp,t’ + RAD*Wrad,t]/[Wnwp,t’ + Wrad,t) The model lead time t’ is generally longer than t for the radar because models are executed less frequently. (But model skill scores are nearly independent of time for the time intervals of interest)
An example of a 2-h KLAPS forecast of a 10-min accumulation made at 0600 UTC on 14-July-2009 and valid for 0800 UTC.
Same KLAPS data as in the previous slide, but converted into a rainfall rate map (mm/h) and over the same domain and map projection used for MAPLE. KLAPS Composite radar map for the corresponding time (1700 KST, 14 July 2009) Relatively good comparison with CSI(0.5 mm/h)=0.40 and Cross-correl=0.313 but large ratio KLAPS/RADAR=2.34 RADAR
KLAPS Spin-up Time Relative rainfall generated by KLAPS forecasts in July 2009 as a function of the forecast length. The amount generated by the 60-min forecasts is taken as reference. The spin-up time is reached within 30 minutes.
Comparisons of KLAPS and of MAPLE forecasts for July 2009 in terms of the indicated skill scores. Bias-corrected results (by dividing by 1.83) are also provided for KLAPS KLAPS skill does not reach MAPLE’s skill even after 6 hours. Therefore, the KLAPS-MAPLE merging is not expected to yield improved forecasts.
More KLAPS-RADAR Comparisons 2-h KLAPS forecast valid for 0200 KST, 9-July-2009, showing a total absence of the stratiform precipitation seen on the composite radar map below but with an excess in convection. KLAPS Composite radar map for the corresponding time CSI(0.5 mm/h)=0.16 Cross-correl=0.026 KLAPS/RADAR=1.35 RADAR
2-h KLAPS forecast valid for 1700 KST, 9-July-2009 KLAPS Composite radar map for the corresponding time CSI(0.5 mm/h)=0.41 Cross-correl=0.374 KLAPS/RADAR=4.64 Better results than 15 hours earlier, but large KLAPS overestimation from excessive convection. RADAR
KLAPS 2-h KLAPS forecast valid for 1700 KST, 28-July-2009 RADAR Composite radar map for the corresponding time CSI(0.5 mm/h)=0.27 Cross-correl=0.302 KLAPS/RADAR=0.82 Good scores but extensive light precip. on radar not captured by KLAPS. Vice-versa for convection.
KLAPS 2-h KLAPS forecast valid for 2000 KST, 28-July-2009 RADAR Composite radar map for the corresponding time CSI(0.5 mm/h)=0.03 Cross-correl=-0.023 KLAPS/RADAR=0.24 No skill three hours later. Light precip. not present on KLAPS forecast. Note possible phase error.
2-h KLAPS forecast valid for 2000 KST, 23-July-2009 KLAPS Composite radar map for the corresponding time RADAR CSI(0.5 mm/h)=0.004 Cross-correl=-0.009 KLAPS/RADAR=0.12 Again, light precip. not on KLAPS. Phase error on the convection.
2-h KLAPS forecast valid for 2000 KST, 11-July-2009 KLAPS Composite radar map for the corresponding time CSI(0.5 mm/h)=0.18 Cross-correl=-0.091 KLAPS/RADAR=0.80 Light & moderate precip. seen on radar but not on KLAPS. Too many convective cells on KLAPS. RADAR
Conclusions and Proposed Future Work 1- Near-Optimal Filtered Forecasts (NOFF) have been applied to Korean radar composites that filter the unpredictable scales with increasing lead time, resulting in significant improved verification scores, including the CSI. 2- Probability maps for various thresholds have been generated and a suggested method of display has been illustrated. 3- A comparison of KLAPS forecasts with radar composites has been made for July 2009. Scores are not as good has hoped for because of the tendency for KLAPS to generate excessive convection at the expense of light or moderate precipitation. Some phase or spatial errors have been noticed. 4- A comparison of KLAPS and of MAPLE forecasts with an independent data set, ie., the Korean AWS network, is proposed as part of a continuing McGill-NIMR collaboration in order to better assess their respective weights in a merged KLAPS-MAPLE forecast.