Download
1 / 20
200 likes | 212 Views
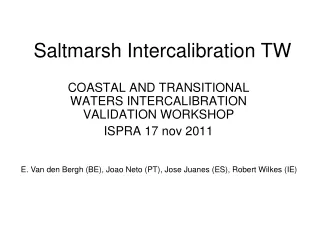
Saltmarsh Intercalibration CW. COASTAL AND TRANSITIONAL WATERS INTERCALIBRATION VALIDATION WORKSHOP ISPRA 17 nov 2011. E. Van den Bergh (BE), Joao Neto (PT), Jose Juanes (ES), Robert Wilkes (IE). 1. Compliance of methods. DE – EM (WISER ID 130): Saltmarsh in CW and TW Metrics:

E N D
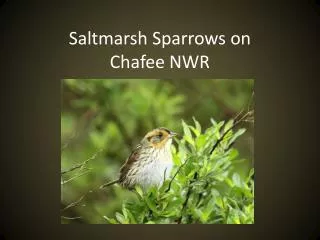
Saltmarsh Intercalibration CW COASTAL AND TRANSITIONAL WATERS INTERCALIBRATION VALIDATION WORKSHOP ISPRA 17 nov 2011 E. Van den Bergh (BE), Joao Neto (PT), Jose Juanes (ES), Robert Wilkes (IE)
1. Compliance of methods • DE – EM (WISER ID 130): Saltmarsh in CW and TW Metrics: • Abundance: SM extent compared to historical reference • Taxonomic composition: Relative representation of SMzones compared to reference Combination rule:Mean • NL – TSM (WISER ID 259, to be adapted): Saltmarsh in CW and TW Metrics: • Abundance: SM extent compared to historical reference • Taxonomic composition: Relative representation of SMzones compared to reference Combination rule: One out All out • UK – SM (under construction): Saltmarsh in CW and TW Metrics: • Abundance: • Saltmarsh extent compared to historical reference • Saltmarsh extent compared to intertidal • Taxonomic composition: • Number of zones compared to maximum • Maximum zone area • Number of species/zone compared to reference Combination rule: Weighted mean
1. Compliance of methods • Abundance = extent • Calculation rule for abundance differs • Disturbance sensitive taxa = vegetation zones • Definition of zones differs • Calculation rule for zonation differs • No species information for NL-DE • REFCOND: historical interpretation and expert judgement, no near natural sites • UK adds species representation for taxonomic composition • All methods comply
2. Feasability Biotypes:subtypological variants based on physical and chemical xtics
4 Pressure Indicators • Hydromorpological pressure • Landclaim % intertidal • Shoreline % reinforcement • Dredge disposal area % subtidal • Summed up as Total HMP • Maximum value as Maximum HMP • For UK only tested on surveillance sites with info on SM extent AND zonation (5wb)
6 Common Metrics • CM 1: SM extent as proportion of reference, truncated at 1 • CM 2: H’ of 4 predefined vegetation zones: pioneer, low, mid, high marsh, normalised to values between 0 and 1 • CM 3: (CM 1 + CM 2)/2
6 Common Metrics/ EQR response Selection of CM3
G/H 60 Total pressure 40 Max pressure 6 Common Metrics Pressure response Reasonable response to total and max hydromorphological pressure
7 REFCOND-BENCHMARK • No unimpacted reference sites in DB • Defined Ref cond • SM extent > 100% Ref • H’ >3,75 • Defined G-H boundary: • SM extent is > 80% Ref • Ref and H’>3,25 (nearly all zones present, no real dominance of one zone) • Total pressure < 60%, max pressure < 40% • Not sufficient alternative benchmark sites in dataset: one dummy added to DB for each MS: EQR=1; CM3=1
Common metric selection: the common metric combining a diversity and abundance metric was concluded not to be appropriate, since the abundance metric was taking into account different Member State views on the reference condition. 9 workshop conclusions • CM3 combining diversity and abundance takes MS views on RC • Take H’ instead; relationship with pressures still to be illustrated. • Continuous benchmarking instead of dummy
Later remarks (W. Bonne) • H’ no good response to pressure • Different appreciation between MS • related to a national view or to existing differences in nature?
Way forward? • Continue with a common metric by using the way of derivation how one Member State did it and apply this to all: already done • The outcome of the calculation sheets probably reflects the good relation of a national view with the national view, • IS SURFACE ACCEPTABLE AS MEASURE FOR ABUNDANCE?