Download
1 / 17
170 likes | 256 Views
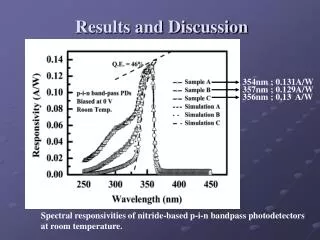
Will Russia face labor force shortage in the next 20 years? (revised Results for discussion ). June 14, 2011. Key introductory points. This exercise does not attempt to estimate the contribution of labor migrants to GDP growth in Russia

E N D
Will Russia face labor force shortage in the next 20 years?(revised Results for discussion ) June 14, 2011
Key introductory points • This exercise does not attempt to estimate the contribution of labor migrants to GDP growth in Russia • It clarifies the gap between projected number of labor force of Russian nationals and required number of labor force to achieve targeted level of GDP under various assumptions on TFP growth, labor participation rate (LPR) and investment-to-GDP ratio • To impose reasonable assumptions we first conduct simple growth accounting exercise to estimate labor, capital and TFP contribution to economic growth in Russian Federation over 2001-2010 period for total and non-oil GDP and at country and regional levels • We chose Central Federal District (as the largest recipient of labor migrants) and North-West Federal District (as region with lower share of labor migrant in total employment), together accounting for the bulk of economic activity in the country. • Methodological approach remained unchanged compared to the first draft, with only exception that we have introduced simulations to demonstrate how deficit/surplus of labor force required to achieve a certain rate of long-term economic growth rate changes depending on long-term TFP growth rate
Methodology • To estimate input factors contribution to GDP growth we use simple growth accounting equation: • where Y is output, A is TFP, L and K are labor and capital inputs and α is labor inputs share • we use GDP (in PPP constant 2000 US$) from the WB WDI as proxy for total output • we use actual employment as proxy for labor inputs and share of wages in GDP as proxy for labor share • we use capital stock adjusted for capital utilization (in PPP constant 2000 US$) for 2000-2005 from the WB dataset developed for ECA Flagship Report “Unleashing Prosperity: Productivity Growth in Eastern Europe and Former Soviet Union” (2007) • we estimate capital stock after 2005 using perpetual inventory method • where I is investment and is capital depreciation rate • we use Gross Fixed Capital Formation (in PPP constant 2000 US$) from the WB WDI database as proxy for investment • we assume that capital depreciation rate is 0.05, which is commonly used in the literature and on average close to actual numbers recorded in official statistics; however for non-oil GDP we make adjustment based on actual depreciation rates as capital depreciation rate in mining sector in Russia is almost two times higher than for total economy • We impose various assumptions on targeted GDP growth, TFP growth, LPR and investment-to-GDP ratio in simulations to estimate potential labor force deficit/surplus under various scenarios • We understand all limitations of this model as well as of the data. We use it only to demonstrate how labor force needs in Russian Federation may change in future depending on targeted economic growth rates, targeted improvements in factors productivity, level of participation of working age population in labor force and investment levels; so the Government could address potential labor force shortage beforehand
Content • Labor force projections under several assumptions regarding LPR • Results of growth accounting at country level • Estimated TFP contribution to GDP growth (total and non-oil) over 2001-2010 • Required TFP growth over 2010-2030 to achieve targeted rate of GDP growth (total and non-oil-gas) under baseline assumptions • Results of simulations to estimate labor force deficit/surplus depending on hypothetical long term TFP growth rates for optimistic and pessimistic cases (for non-oil-gas GDP) • optimistic case: stronger economic growth, higher investment rate and higher LPR compared to baseline • pessimistic case: moderate economic growth, low investment rate and baseline LPR • Results of growth accounting at regional level • Estimated TFP contribution to GRP growth over 2001-2009 for Central and North-West federal districts, as non of these two regions is major oil/gas producer we do not differentiate between oil and non-oil GDP • Results of simulations to estimate labor force deficit/surplus depending on a hypothetical long term TFP growth rates for optimistic and pessimistic cases (as defined for country-level simulations) • Annex I: Data sources • Annex II. Economic Growth in Top Eight Resource-Rich countries
Labor force projections under different assumptions on Labor Participation rates (LPR) based on National Population Forecast (base line) • Source: own calculations based on RF National Statistics Committee data
Labor force projections under different assumptions on Labor Participation rates (LPR) based on National Population Forecast (optimistic) • Source: own calculations based on RF National Statistics Committee data
Labor force projections under different assumptions on Labor Participation rates (LPR) based on National Population Forecast (pessimistic) • Source: own calculations based on RF National Statistics Committee data
Results of Growth Accounting at Country Level: total GDP • Estimated TFP contribution to GDP growth over 2001-2010 and required TFP growth over 2010-2030 under baseline assumptions: to achieve targeted GDP growth (conservative 4.5 percent per year*), investment-to-GDP ratio equal to 2005-2010 average, and 3 scenarios for different LPRs • * Based on weighted average annual growth rate for the top four developing recourse-rich countries (Brazil, Chile, China and South Africa) during 2000-2009 (see Annex II)
Results of Growth Accounting at Country Level: non-oil-gas GDP • Estimated TFP contribution to non-oil-gas GDP growth over 2001-2010 and required TFP growth over 2010-2030 under baseline assumptions: to achieve targeted non-oil-gas GDP growth (assuming that oil and gas sector contribution will be on average negative 0.5 percent per year for 2011-2020 and zero percent for 2021-2030), investment-to-GDP ratio equal to 2005-2010 average, and 3 scenarios for different LPRs
Results of Growth Accounting at the Country Level: • Simulated labor deficit/surplus depending on TFP growth rates (Optimistic case) • Assumptions: • 6.0 percent non-oil-gas GDP growth • 2.5 percent across the board increase in LPR • Investment-to-GDP ratio in non-oil-gas sector is 25% of GDP • Interpretation: • Domestic labor supply will be sufficient if long-term productivity growth is about 4.5 percent per year over 2010-2030 • 0.5 annual productivity growth yields substantial labor force deficit • 5.0 annual productivity growth yields small labor surplus
Results of Growth Accounting at the Country Level: • Simulated labor deficit/surplus depending on TFP growth rates (Pessimistic case) • Assumptions: • 3.0 percent GDP growth • Base case LPR • Investment-to-GDP ratio in non-oil-gas sector is 15% of GDP • Interpretation: • Domestic labor supply will be sufficient if long-term productivity growth is about 3.2 percent per year over 2010-2030 • 0.5 annual productivity growth yields substantial labor force deficit • 5.0 annual productivity growth yields notable labor surplus
Results of Growth Accounting at Regional Level: Estimated TFP contribution to GRP growth over 2001-2009 • Central Federal District (CFD): share of migrants in total number of employed was 5.4 percent in 2008, with the highest share of 10.3 percent for Moscow • North-West Federal District (NWFD): share of migrants in total number of employed was 2.8 percent in 2008
Results of Growth Accounting at Regional Level (I): • Simulated labor deficit/surplus depending on TFP growth rates * Scenarios at national level are estimated for non-oil-gas GDP
Results of Growth Accounting at Regional Level (II): • Simulated labor deficit/surplus depending on TFP growth rates
Concluding observations • The analysis indicates that domestic supply of labor in Russian Federation could be sufficient to ensure long-term non-oil-gas growth rate of above 3.0 percent with moderate level of investments in non-oil-gas sectors (of 15% of GDP) if the country is able to sustain strong productivity growth rates of above 3.2 percent per year in a long-term; • Above 6.0 percent long-term non-oil-gas growth rate combined with investment rate of 25% of GDP in non-oil-gas sectors will require stronger TFP growth of about 4.5 percent per year in long term, which could be feasible for the country like Russia– example of Korea over the period of 1985-2008, when annual TFP growth averaged at about 4 percent, proves it’s possible; • The higher economic growth targets or lower TFP growth rates in a long-term could require larger capital investments or higher growth rates of labor force. The later will likely lead to a shortage of labor, which can be addressed through various policy interventions, including among others measures aimed at increasing LPRs, improving health/education outcomes, or attracting labor migrants from abroad; • The exercise yields results which are consistent at country and regional levels.
Annex II. Economic Growth in Top Eight Resource-Rich countries Source: WB WDI database, own calculations