Download
1 / 54

E N D
Demographic Summary • The audience for tea is changing as rapidly as the market for tea is expanding. What was once a predominately female, older consumer, has evolved into a much broader target audience depending upon the specific segment and drinking occasion.Historically, the average purchaser of tea bags in the United States was female, 35-55 years of age. The consumers of the beverage she prepared were also a little older than the average dispersion of age within the population. This indicated that younger people were not being introduced to the joys of drinking tea and new consumers were hard to come by. • A breakdown of the traditional demographics follows:
Demographic Summary • By Gender
Demographic Summary • By Age Group
Demographic Summary • By Location of Consumption
Demographic Summary • By Time of Day
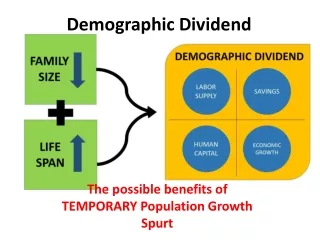
Demographic Summary • With the advent of the Ready-To-Drink segment, demographics have changed dramatically. The target audience is young men between the ages of 14-28. Consumers or R-T-D tea are not unlike consumers of soft drinks. They tend tocross gender lines, age groups and approximate as close to an all-family groupas is possible.Iced tea mixes also tend to skew much younger than the market for tea bags which bodes well for the future of the industry. Young people are the life blood of the tea industry as they will likely be responsible for a significant expansion of the market as they age and experiment with other forms of tea.
Percent of Households Buying • By Form *Includes Specialty/Herbal
Household Lifestage Segments • Based On HH Composition Vs. Age Of Male/Female HeadVs Age/Presence Of Children
Regular Tea BagsAverage Price (In Cents) Per 8 Oz. Serving • Total U.S. – Calendar 1994
Regular Tea Bags Buyer and Volume Indices • Total U.S. – Calendar 1994
# Of Households Purchasing (Millions)All Outlets — Total U.S. • Total # Of Households — 98.5 Million
Average Spending On CategoryPer Category Trip • All Outlets — Total U.S.
Average # Of Category PurchasesPer Year Among Category Buyers • All Outlets – Total U.S.
Annual Category Spending Per Buyer • All Outlets – Total U.S.
Average Shopping Basket Size When Category Is Purchased • All Outlets – Total U.S.
Shopping Trips In Alternative Channels And Trip Conversion • Total U.S. Point Chg YA: -1.0 -0.8 +0.2 +0.3 +0.4 NC +0.4 -0.5
Average Shopping Basket Size When Category Is Purchased In The Channel • Total U.S. Discount Stores Warehouse Clubs
Buyer Conversion • (% Of Category Buyers Who Shop In The Channel AndWho Buy The Category In The Channel) Total U.S. Warehouse Clubs Discount Stores Tea Bags Tea Bags Ground Coffee Ground Coffee Herbal Tea Herbal Tea Flavored Soluble Coffee Flavored Soluble Coffee
Average Shopping Basket Size When Category Is Purchased In The Channel • Total U.S. Warehouse Clubs Discount Stores Tea Bags Tea Bags Ground Coffee Ground Coffee Herbal Tea Herbal Tea Flavored Soluble Coffee Flavored Soluble Coffee
Buyer Conversion • (% Of Category Buyers Who Shop In The Channel AndWho Buy The Category In The Channel) Total U.S. Pt Chg YA:
Specialty Tea Institute • Per Capita Global Tea Consumption Patterns • Americans consume more than 50 billion servings of tea a year, nearly 85% of which is iced. Over 90% of the tea consumed is Black Tea, about 5% Green Tea, 1% Oolong Tea and the balance flavored, scented, or mixed teas.About 200 million pounds of tea leaves (bagged & loose) are shipped into the United States each year as well as significant quantities of instant tea. Nearly 80% of U.S. Households buy tea and about half the population is consuming tea on a daily basis.Relative to citizens in other countries, the market for tea in the United States is significantly under developed. However, despite that, the United States is still the4th largest tea-importing nation in the world after the United Kingdom, the former Soviet Union, and Pakistan.
Specialty Tea Institute • Per Capita Global Tea Consumption PatternsOn a per capita basis, the following statistics will putthe U.S. tea consumption patterns into global perspective
Today’s Specialty Tea Consumer • As seen in NASFT Showcase • The NASFT is pleased to present groundbreaking demographic research on Today’s Specialty Tea Consumer. In previous issues of NASFT Showcase we presented vital demographic information on specialty food consumers in general. In this issue, we delve into the factors that specifically influence specialty tea purchases. • Throughout 1999, NASFT Showcase will present additional statistics on the demographics of buyers of specific categories, such as chocolates, coffees, jams and jellies, olive oil, cheese and so on. • About The Research • The NASFT research is based on information provided by Spectra, a market research company that combines data from many sources to develop a demographic profile of consumers. Databases used by Spectra include the U.S. Census Bureau, the A.C. Nielsen Homescan Household Panel, Scarborough Reports, MRI and so on. To create the specialty tea consumer profile, the NASFT amalgamated nine specialty tea brands into one list – in essence a single brand of specialty tea. By Ronald Tanner and Denise ShoukasEditor and Managing Editor, respectively, NASFT Showcase
Today’s Specialty Tea Consumer • Where They Live • Specialty tea consumption is much higher in the West, where people are more apt to sit back and enjoy life sip by sip. Consumers in the Mountain region are the most likely to purchase specialty teas (+64%), followed by those in the Pacific region (+49%). New England is also a good census division for the sales of specialty teas. Specialty TeaBuyers Index New England: CT, MA, ME, NH, RI, VT Middle Atlantic: NJ, NY, PA South Atlantic: DE, DC, FL, GA, MD, NC, SC, VA, WV East South Central: AL, KY, MS, TN West South Central: AR, LA, OK, TX East North Central: IL, IN, MI, OH, WI West North Central: IA, KS, MN, MO, NE, ND, SD Mountain: AZ, CO, ID, MT, NV, NM, UT, WY Pacific: AK, CA, HI, OR, WA Percent of U.S. Population
Today’s Specialty Tea Consumer • The Demographics • Census division, household income and education are the three most influential factors in specialty tea consumption. The best consumers have household incomes of more than $100,000 (+50%), especially if they live in the Mountain region (+64%), and are college graduates (+49). Age is also a significant factor, with the aging baby boomers (45-54 years old) being the best specialty tea drinkers. A breakdown of the demographics follows:
Today’s Specialty Tea Consumer • Number of Persons — Demographics
Today’s Specialty Tea Consumer • Household Income — Demographics
Today’s Specialty Tea Consumer • Householder Age — Demographics
Today’s Specialty Tea Consumer • Race — Demographics
Today’s Specialty Tea Consumer • Age And Presence Of Children — Demographics
Today’s Specialty Tea Consumer • Housing Tenure — Demographics
Today’s Specialty Tea Consumer • Householder Education — Demographics
Today’s Specialty Tea Consumer • Nielsen County Size — Demographics
Today’s Specialty Tea Consumer • Household Income — Demographics
Today’s Specialty Tea Consumer • How Much They Earn? • All households with incomes in excess of $50,000 are better than average buyers of specialty teas, proving that specialty tea is not just a beverage for the wealthy. Specialty Tea Buyers Index Percent of U.S. Population
Today’s Specialty Tea Consumer • How Old Are They? • The aging baby boomers, age 45-54, are by far the best consumers of specialty teas, 20% more likely than the average consumer to purchase. Perhaps these people are concerned about caffeine consumption and have switched over to specialty and herbal teas. The Pepsi Generation, people aged 18-24, are the least likely to buy specialty teas (-23%). Specialty Tea Buyers Index Percent of U.S. Population
Today’s Specialty Food Consumer • The Lifestyles • The NASFT is pleased to present groundbreaking demographic research on the lifestyles of Today’s Specialty Food Consumer. This information will help retailers, restaurateurs, caterers, manufacturers, gift shop owners, importers and others who sell specialty food understand how their customers live. • In the January/February issue of NASFT Showcase, we presented vital demographic information on specialty food consumers. Some of the highlights included: • Education is the second most important demographic factor, with college graduates 51% more likely to buy. • Two-person households are more likely to purchase than people who live alone or in larger households. • Income is the most significant factor in determining specialty food purchases, with households earning in excess of $100,000 being 85% more likely to purchase. • Factors such as age and even the presence of children are not as significant as income and education.
Today’s Specialty Food Consumer • The Lifestyles • In this issue, we delve into the geographic and lifestyle factors that influence specialty food purchases. • Throughout 1999, NASFT Showcase will present additional statistics on specialty food consumers, including data on the demographics of buyers of specific categories, such as chocolates, coffees, jams and jellies, olive oil and cheese.
Today’s Specialty Food Consumer The Lifestyles • People who enjoy an elite and affluent lifestyles are, understandably, the strongest purchasers of specialty foods. The best buyers live in the suburbs, not in the city. Surprisingly, consumers in secondary cities are just as likely to buy specialty foods as those that live in Suburban centers. A breakdown of the Lifestyles follows:
Today’s Specialty Tea Consumer • The Lifestyle — Suburban Areas
Today’s Specialty Tea Consumer • The Lifestyle — Suburban Areas
Today’s Specialty Tea Consumer • The Lifestyle — Secondary Cities
Today’s Specialty Tea Consumer • The Lifestyle — Towns
Today’s Specialty Tea Consumer • The Lifestyle — Rural Areas
Definitions of Lifestyle Clusters With Above Average Specialty Food Buyers’ Index (continued) • Elite Urban • Members of this lifestyle are most often older, typically 55-plus, financially established couples either without children or with children already grown.Most are well-educated professionals. They enjoy expensive liquors, classical or jazz music, and traveling overseas. • Affluent Urban • These are young, predominantly 25- to 44-year-old, highly educated, single professionals. They rent apartments in densely populated Suburban areas and are career-oriented. Most enjoy sports, public television and foreign travel, focus on health and exercise, and read epicurean magazines.
Definitions of Lifestyle Clusters With Above Average Specialty Food Buyers’ Index (continued) • Upper/Midscale Urban • Well-educated renters in densely populated Suburban areas with a higher ethnic and immigrant population than the Affluent Suburban. They are in their late 20s and are predominantly single without kids. They are in touch with current trends in fashion, music and entertainment. • Elite Suburbs • This group shows peak indices in income, education, occupation and extravagant lifestyle interests. Most of these mid-aged executives are homeowners without children. When not working on their personal computers, they enjoy vacations overseas, elaborate cocktail parties, classical music, sailing, aged brandy or whiskey and reading.
Definitions of Lifestyle Clusters With Above Average Specialty Food Buyers’ Index (continued) • Affluent Suburbs • These nouveau riche suburban professionals are well educated with high incomes. Most are married with high school age children. They enjoy tennis, boating and jazz/classical music. • Upper/Midscale Suburbs • These well-educated 30-something are family-oriented. They spend much of their free time with their children. These homeowners are likely to be seen in a family station wagon and prefer bowling or attending a family theme park. They aresports-oriented.
Definitions of Lifestyle Clusters With Above Average Specialty Food Buyers’ Index (continued) • Midscale Suburbs • Most of these married, well-educated, predominantly white empty nesters are professionals/managers or have recently retired. This group is financially secure and likes to spend and utilize their moderate wealth. They enjoy taking foreign trips, golfing, classical music, watching public television, and attending the theater. • Affluent Secondary Cities • This white-collar second city suburban group skews high in income and education. These married homeowners and their children reside in stable neighborhoods. Most read newspapers, books and magazines, lead epicurean, health-conscious lives and can be found with friends at a cocktail party.
Definitions of Lifestyle Clusters With Above Average Specialty Food Buyers’ Index • Affluent Towns • These mid-aged families skew similar to the Elite Suburban in regards to income, education and occupations. They keep constant tabs on general news, business and finance trends. Business trips and clubs occupy a portion of their time. These nature lovers play golf, watch television with their family, have barbecues or work in the garden. They spend vacations overseas and give elaborate cocktail parties. • Upper/Mid-scale Towns • Within their small town, they’re in an economic class by themselves. They have a relatively high education level and are generally craftsmen. They usually have a personal computer, are likely to have a family station wagon or truck, and choose country cassettes over CDs. They love the outdoors, observe current health and fitness trends and go camping.