Download
1 / 28
280 likes | 509 Views
13 th Sept 2016 Joanne Casey. A closer look at sociodemographic patterns of food purchasing and dietary intake in Northern Ireland. Aims for today . Nutrition surveillance in NI National Diet and Nutrition survey Kantar WorldPanel Marker Foods By sociodemographic category.

E N D
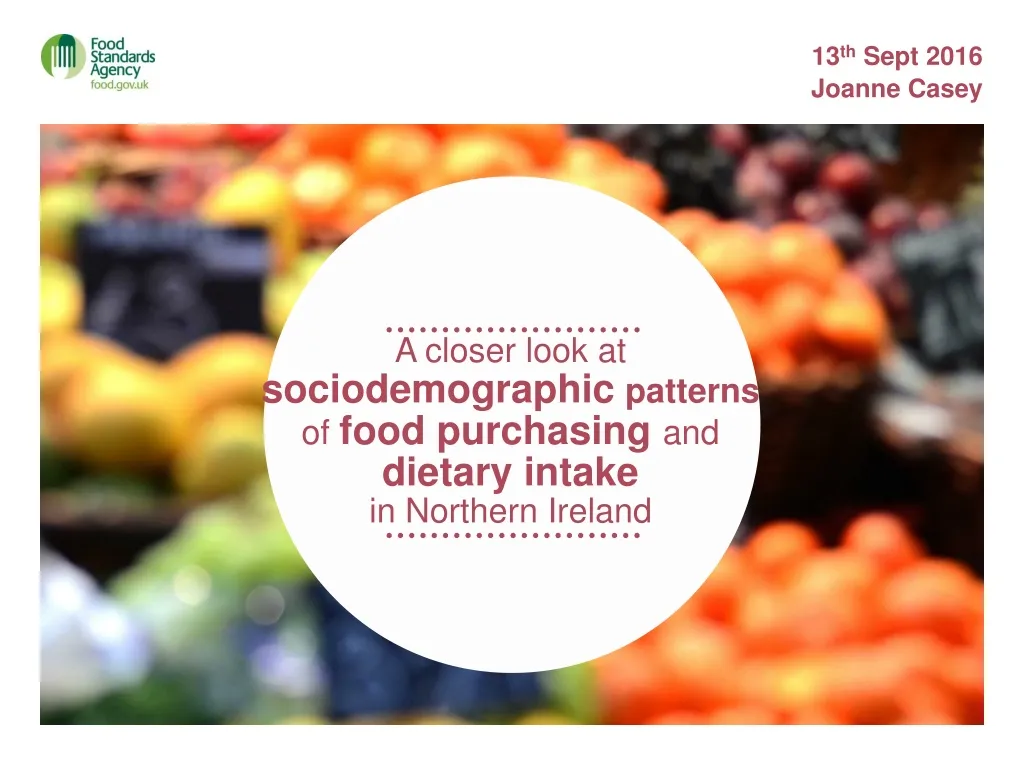
13th Sept 2016 Joanne Casey A closer look at sociodemographicpatterns of food purchasing and dietary intake in Northern Ireland
Aims for today • Nutrition surveillance in NI • National Diet and Nutrition survey • Kantar WorldPanel • Marker Foods • By sociodemographic category
NI health and social care inequalities monitoring system SOURCE: NI health and social care inequalities monitoring system (HSCIMS)-health inequalities in Northern Ireland: key facts 2015
What about Nutrition? • Health survey NI • Reported frequency of intake of key food and drink items
Nutrition surveillance in NI • FSA in NI responsible for monitoring the diet of the population in NI • National Diet and Nutrition Survey • Kantar Worldpanel
FSA in NI: Nutrition Surveillance • National Diet & Nutrition Survey • Assess the diet, nutrient intake& nutritional status(aged ≥1.5 years) • Recruitment in NI boosted 200 /year, representative data • NI boost co-funded by DoH, Safefood & FSA in NI • Years 1-4 report published Official Statistic • Marker foods • Equivalised income tertile
FSA in NI: Nutrition Surveillance • Kantar Worldpanel • Annual take-home purchasing data since 2006 • Purchasing not consumption • 650 households in NI –handheld scanner • 32 food & drink categories • Does not consider food purchased out-of-home or waste • Marker Foods • ABC1: Upper Middle, Middle and Lower Middle • C2DE: Skilled Worker, Working & Non Earners
Northern Ireland Cross-Departmental Obesity Prevention Strategy: • A Fitter Future for All – A Framework for Preventing and Addressing Overweight and Obesity in Northern Ireland 2012-2022 • Marker foods • fruit and vegetables; • sugary, fizzy drinks and squashes; • confectionery; • chips and other fried foods; • meat products. • The purpose of the “marker foods” is to monitor those food categories which are of public health interest
National Diet and Nutrition Survey Key findings Year 1-4
NI consumer is eating - • Too much Not enough
60% too much sugar 30% too much red meat 19-64y men 11-18 years 36% too little F&V 75% too little oily fish
In other words… £££ higher income households eating more Vit & Min Nutrients Foods Iron Vitamin C&D Folate Fruit and Vegetables Confectionery Protein Carbohydrate Fibre
In other words… £Lower income households eating more Foods Vit & Min Nutrients Fat Sugar Sugary fizzy drinks Chips and fried foods Meat products
Kantar 2014 data
Purchasing: Family type Middle Mix Buying more Take home savouries Regular soft drinks Diet soft drinks Meat and fish products Chips and other potato Empty nest / Retired Buying more Fruit Fish Oily fish Cured meat Cakes and pastries Spirits • Pre and Young • Buying more • Take home savouries • Regular soft drinks • Chips and other potato
Purchasing: Urban / Rural Rural households Buying more Chips and other potato products Meat and fish products Tea breads High fat / sugar morning goods • Urban households • Buying more • Ready meals • Fish • Oily fish • Fruit juice and smoothies
Sugary fizzy drinks Lower income households Purchasing more Drinking more (not significant) Higher income households Purchasing less Drinking less (not significant) £ £££
Fruit and Vegetables • Lower income households • Purchasing less vegetables, more fruit • Eating less, less number of portions and less achieving 5 A Day • Higher income households • Purchasing more vegetables, less fruit • Eating more, more portions and more achieving 5 A Day £ £££
Meat products £ £££ Lower income households Purchasing more Eating more Higher income households Purchasing less Eating less
Chips, other fried food / other potato products £ £££ Lower income households No difference in purchasing Eating more, particularly children Higher income households No difference in purchasing Eating less
Confectionery £ £££ Lower income households Purchasing more Eating less Higher income households Purchasing less Eating more
Conclusions • NI specific data • Policy