Download

1 / 8
80 likes | 476 Views
Experiment 27 March 9, 2010 Dr. Scott Buzby , Ph.D. Determination of the solubility-product constant for a sparingly soluble salt. Learn to experimentally determine the solubility constant (K sp ) for a salt Practice operation of a spectrophotometer

E N D
Experiment 27 March 9, 2010 Dr. Scott Buzby, Ph.D. Determination of the solubility-product constant for a sparingly soluble salt
Learn to experimentally determine the solubility constant (Ksp) for a salt Practice operation of a spectrophotometer Further explore the use of a calibration graph and Beer-Lambert Law Objectives
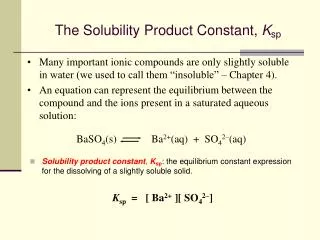
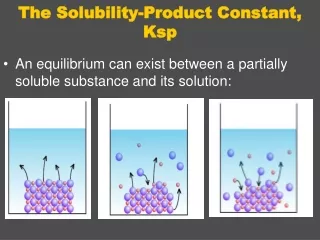
For a true equilibrium to exist between a solid and a solution, the solution must be saturated (i.e. solid material must remain at the bottom of the solution) The solubility of silver carbonate is expressed by the equation: solubility constant (Ksp)
We will use a spectrophotometer to determine the intensity of the color of a solution Described on pages 310 & 312 in you text Absorbance is related to concentration by the Beer-Lambert Law spectrophotometer
A – Absorbance of the solution a – Molar absorption coefficient (constant) b – Path length (constant) c - Concentration Beer-Lambert Law
Using a Calibration Curve • Prepare a series of solutions of a known concentration • Plot absorbance vs. concentration for the known solutions • By measuring absorbance of an unknown sample you can determine concentration using your plot (follow red arrows on graph) • Procedure on page 311
FOLLOW ALL INSTRUCTIONS PRECISELY!!! Prepare three separate solutions according to the procedure on page 312 Determine the chromate concentration, [CrO42-], using your calibration graph Calculate silver concentration, [Ag+], and Ksp for you solution (see notes on page 313) Determination of Ksp
Next Week – Nothing Enjoy Spring Break! • Next Class (3/23/2010) • Report Sheet – Pgs. 315-316 • Questions – Pgs. 316-317 • Calibration Graph – Pg. 318 or print-out • Pre-Lab Experiment 28 – Pg. 323 For Next Class