Download
1 / 2
20 likes | 168 Views
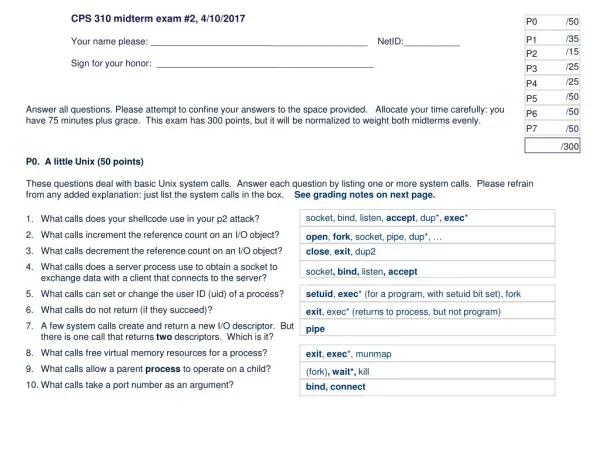
Supplementary Figure 1. FENa>1. FENa>1. FENa<1. FENa<1. No AKI. No AKI. Transient AKI. Transient AKI. Renal AKI. Renal AKI. A. b. 300. a. c. 200. Urinary Na (mEq/l). 100. 0. B. 250. a. 200. a. a. 150. Urinary Cre (mg/dl). 100. 50. 0.

E N D
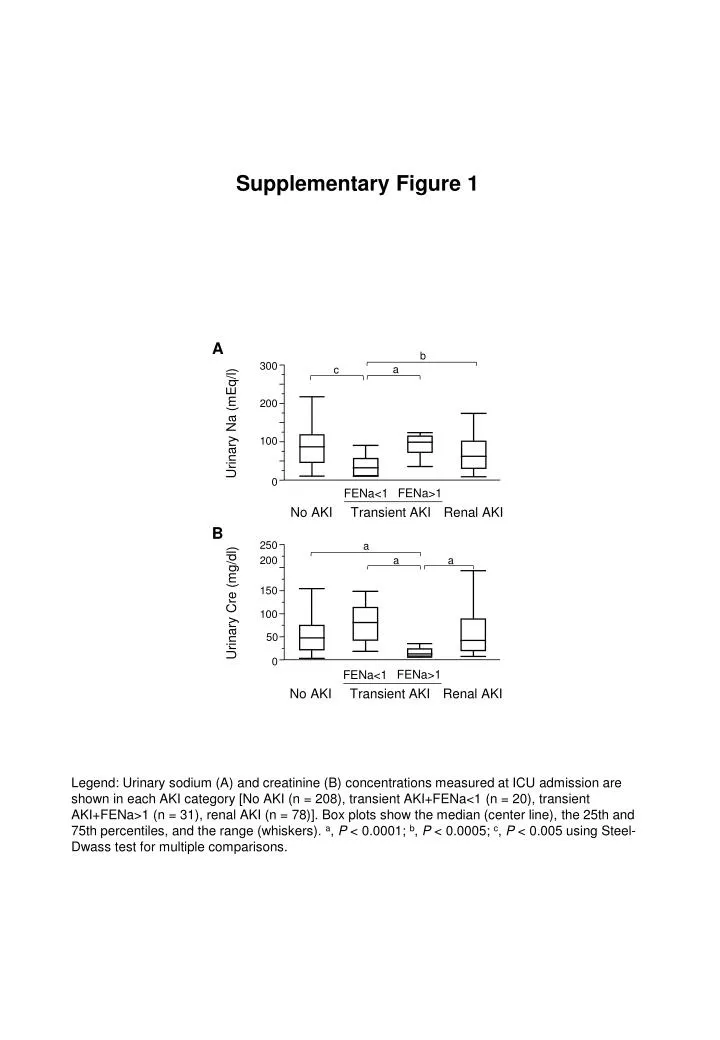
Supplementary Figure 1 FENa>1 FENa>1 FENa<1 FENa<1 No AKI No AKI Transient AKI Transient AKI Renal AKI Renal AKI A b 300 a c 200 Urinary Na (mEq/l) 100 0 B 250 a 200 a a 150 Urinary Cre (mg/dl) 100 50 0 Legend: Urinary sodium (A) and creatinine (B) concentrations measured at ICU admission are shown in each AKI category [No AKI (n = 208), transient AKI+FENa<1 (n = 20), transient AKI+FENa>1 (n = 31), renal AKI (n = 78)]. Box plots show the median (center line), the 25th and 75th percentiles, and the range (whiskers). a, P < 0.0001; b, P < 0.0005; c, P < 0.005 using Steel-Dwass test for multiple comparisons.
Supplementary Figure 2 A B a a c a 10000 10000 c 1000 1000 100 100 L-FABP (ng/ml) L-FABP (μg/gCre) 10 10 1 1 0.1 0.1 C D FENa>1 FENa>1 FENa<1 FENa<1 a a No AKI No AKI Transient AKI Transient AKI Renal AKI Renal AKI c 10000 10000 d c 1000 1000 100 100 NGAL (ng/ml) NGAL (μg/gCre) 10 10 1 1 0.1 0.1 E F a a c b 10000 10000 a d 1000 1000 IL-18 (pg/ml) IL-18 (ng/gCre) 100 100 10 10 1 1 G H c c a 150 300 b c 200 100 NAG (IU/l) NAG (IU/gCre) 100 50 0 0 a I J a d 100 2000 b d a 1500 Alb (mg/dl) Alb (mg/gCre) 50 1000 500 0 0 Legend: : Urinary biomarkers measured at ICU admission are shown in each AKI category [No AKI (n = 208), transient AKI+FENa<1 (n = 20), transient AKI+FENa>1 (n = 31), renal AKI (n = 78)]. a, P < 0.0001; b, P < 0.0005; c, P < 0.005; d, P < 0.05 using Steel-Dwass test for multiple comparisons.