Download
1 / 29
290 likes | 456 Views
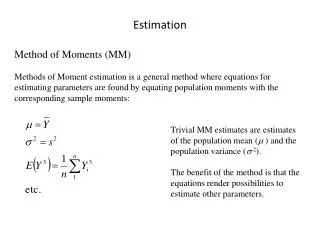
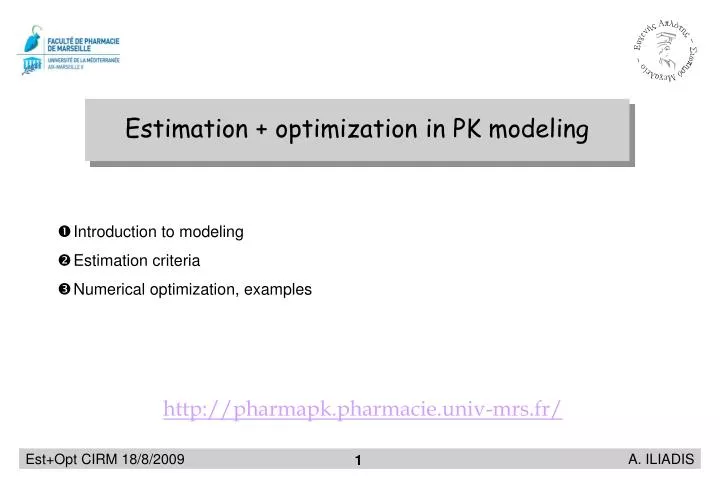
Estimation + optimization in PK modeling. Introduction to modeling Estimation criteria Numerical optimization, examples. http://pharmapk.pharmacie.univ-mrs.fr/. Real process and mathematical model. Real process. Fitted model. Math. model. Functional scheme. Measurement noise.

E N D
Estimation + optimization in PK modeling • Introduction to modeling • Estimation criteria • Numerical optimization, examples • http://pharmapk.pharmacie.univ-mrs.fr/
Real process and mathematical model Real process Fitted model Math. model
Functional scheme Measurement noise Observation PK process + Administration protocol A priori information Equivalence criterion Prediction PK model Nonlinear programming
Mathematical modeling • Models are defined by : • - their structure ( number and connectivity of compartments, etc ) expressed by mathematical operations involving adjustable parameters : • Ex : 1-cpt, • exponential structure, parameters : • - the numerical value of parameters used : CHARACTERIZATION Structure ESTIMATION Parameters + MODELING System Identification
Checking identifiability • Structural identifiability : given a hypothetical structure with unknown parameters, and a set of proposed experiments (not measurements !), would the unknown parameters be uniquely determinable from these experiments ? • Parametric identifiability : estimating the parameters from measurements with errors and optimize sampling designs. : structural non-identifiableNon-consistent estimate 1 2
Structural identifiability • It depends on the observation site ! • Solutions : • Grouping : ¨ But ONLY identifiable parameters : • Setting : 1 2 1 2
Functional scheme (dynamic) Linear / p model : no loop, one stage estimation. Nonlinear / p model : many loops until convergence. Measurement noise PK process + Administration protocol A priori information Equivalence criterion PK model Arbitrary initial values Nonlinear programming
Arbitrary initial values Iterations, parameter convergence • Ex : Fotemustine neutrophil toxicity : Nonlinear modeling : Optimized final values
Initial parametric error (canceled at the convergence) Residual error Errors in the functional scheme • The existing errors : • experimental, • structural, • parametric. • Residual error : • experimental, • structural (model • misspecification).
Parametric and output spaces Parametric space Output space Observation PK process Real process Comparison Comparison Prediction PK model Artificial mechanism Random component Precision of estimates Measurement error
Optimal estimation • Estimation is the operation of assigning a numerical values to unknown parameters, based on noise-corrupted observations. • Organization of the variables : • The observed drug concentrations over time, (dimensional vector). • The random parameters to be estimated, (dimensional vector). • Consider the joint pdf and then : • the marginal is called prior pdf [ the marginal is not of interest ]. • the conditional is called posterior pdf : • the conditional leads to the likelihood function : MAP MLE
Maximum a posteriori (MAP) • Design : A reasonable estimate of would be the mode of the posterior density for the given observation : • Ex : • if • if • The role of the dispersion.
Maximum likelihood (MLE) • Design : After the observation has been obtained, a reasonable estimate of would be , the value which gives to the particular observation the highest probability of occurrence : • Ex : • if • if • The role of the precision.
MLE criterion for single - output • Initial form : • Hypotheses : H0 : The model is an exact description of the real process. • ErrorOutput H1 : Additive error : H2 : Normal error : H3 : Independence :
Estimate ! Variance heterogeneity • The regression model : • assumes that • Need to relax this assumption (particularly when the model is highly nonlinear). • Transformed models • Find a transformation function under which the error assumptions hold, i.e. : • where • Box – Cox transformations : • Other transformations : John – Drapper, Carroll, Huber, etc.
General form of the MLE criterion • For available observed data and under the H3 hypothesis the estimator becomes : • Where : if • is the criterion function to be minimized. • The 1st term is known as the extended SE term. • The 2nd term is called the weighted SE term. It is the only one involving observed data and it is weighted by the uncertainty of experiment.
Criterion and error variance model • After introducing the error variance model : • is minimum along the direction when : • or with • Then : • Nonlinearly unconstrained optimization : • Find : • Assumptions : is computable for all and analytic solution does not exist.
Iterative solutions • Solution for the nonlinear optimization problem • Sequentially approximate starting from an initial value and converging towards • a stationary point. • Design a routine algorithm generating the converging sequence : • Terminology : is the initialization and obtaining from is an iteration. • Assign :
Approximation of functions • Taylor's expansion for smooth multivariate function: • Construct simple approximations of a general function in a neighborhood of the reference point . With • a vector of unit length supplying the direction of search, and • a scalar specifying the step length: • Associate successive approximations to iterations :
Direction of search • Linear approx. of : • The scalar gives the rate of change of at the point along the direction . • To reduce , move along the direction opposite to : the descent direction. • Quadratic approx. of : • The scalar involves the second derivative of . • characterizes an ellipse. To reduce , move along the direction targeting • the center of ellipse : : the Newton direction
Line search • Minimization directions : moving along the Newton direction for quadratic surfaces, near . Elsewhere, move along the descent direction. • Line search : to complete the iteration search for in the direction of search : • or 4.5 Minimization direction 4.5 3.8 3.4
Families of algorithms • Practical : Approximate derivatives by finite-differences instead analytical calculation. • Classify : • Twice-continuously differentiable : • Second derivative : quadratic model of , compute and invert (not numerically stable, time consuming processing). • First derivative : quadratic model of , approximate : • without inverting but directly from by finite-differences of . • quasi-Newton methods (appropriate in many circumstances) : BFGS, DFP,... • Non-derivative : linear model of . Approximate by finite-differences of (for smooth functions) : Powell, Brent,... • No assumptions on differentiability : heuristicalgorithms : NMS, Hooke-Jeeves,...
The information matrix • The Fisher information matrix : For MLE estimation : • Cramér-Rao inequality : • is a lower bound of the covariance matrix , evaluating the precision of . • In practice : With the vector of the sampling times, • Obtain the sensitivity matrix with elements , • Set and the order diagonal matrices having as elements • and respectively.
Covariance (precision) matrix • The order precision matrix is : • Dependence on the sampling protocol: • Graphic interpretation of the precision matrix : • is symmetric, and, if , it is also definite positive (by construction). • If , then is an a dimensional ellipsoid. • The volume of the ellipsoid is : Sums of weighted products of sensitivity functions over the available sampling times The lowest , the most precise
Check the structural identifiability • The sensitivity matrix depends : • On the experiment (not measurements !) and • On the model parametrization (structural and parametric) . • Ensure definite-positivity of the sensitivity matrix : • It must be of full rank for any numeric value of the parameters, e.g., for the arbitrary initial values (several). • Ex : • Observation in the central cpt free • # central cpt fixed • # peripheral cpt ? ?
Simulation in optimization • 2-cpt model : • Administration : • IV bolus • Observation : • Horizon • nbr • Heteroscedastic