Download
1 / 49
490 likes | 686 Views
Data Warehousing and OLAP. Definition. Data Warehouse A subject-oriented, integrated, time-variant, non-updatable collection of data used in support of management decision-making processes Subject-oriented Data warehouse is organized around the key subjects of the enterprise

E N D
Definition • Data Warehouse • A subject-oriented, integrated, time-variant, non-updatable collection of data used in support of management decision-making processes • Subject-oriented • Data warehouse is organized around the key subjects of the enterprise • e.g. customers, patients, students, products • Integrated: • Consistent naming conventions, formats, encoding structures; from multiple data sources • Time-variant: • Data contain a time dimension: may be used to study trends and changes • Non-updatable: • Read-only, periodically refreshed • Data Mart • A data warehouse that is limited in scope
Introduction • Data warehousing is the process whereby organizations create and maintain data warehouses and extract meaning and inform decision making from their informational assets through these data warehouse
Introduction Applications that data warehouse supports are: OLAP (Online Analytical Processing) is a term used to describe the analysis of complex data from the data warehouse. DSS (Decision Support Systems) also known as EIS (Executive Information Systems) supports organization’s leading decision makers for making complex and important decisions. DataMining is used for knowledge discovery, the process of searching data for unanticipated new knowledge.
Need for Data Warehousing • A business requires integrated, company-wide view of high-quality information (from different databases) • IS department must separate informational from operational systems to improve performance in managing company.
Need for a Company-wide View • For decision making: necessary to provide a single, corporate view of the information • Example of the difficulty of deriving a single corporate view
From Class Registration System From Personnel System From Health Centre System Examples of heterogeneous data
Need for a Company-wide View • Issues need to be resolved: • Inconsistent key structures • Synonyms • Free-form fields versus structured fields • Inconsistent data values • Missing data
Need for a Company-wide View • Why organizations need to bring data together from various systems of record? • More profitable • More competitive • To grow by adding value for customers • Accomplished by: • Increasing speed and flexibility of decision making • Improving business processes • Gaining a clear understanding of customer behavior
Need to Separate Operational and Informational Systems • Operational system: • a system that is used to run a business in real time, based on current data; also called a system of record • Must process large volumes of relatively simple read/write transactions, while providing fast response. • Example: sales order processing, reservation systems • Informational system • a system designed to support decision making based on historical point-in-time and prediction data for complex queries or data-mining applications • Example: Sales trend analysis, customer segmentation
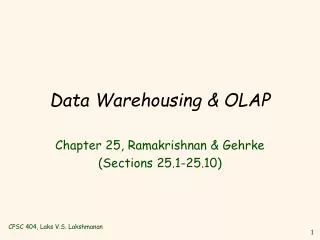
Data Warehouse Architectures Independent Data Mart Dependent Data Mart and Operational Data Store Logical Data Mart and Real-Time Data Warehouse Three-Layer architecture All involve some form of extraction, transformation and loading (ETL)
Data Mart A data warehouse that is limited in scope, whose data are obtained by selecting and summarizing data from a data warehouse or from separate extract, transform and load processes from data source systems.
Independent Data Mart A data mart filled with data extracted from the operational environment without benefit of a data warehouse Four basic steps: Data are extracted from various internal and external source system files and databases Data are transformed and integrated before being loaded into the data marts Transactions may be sent to the source systems to correct errors discovered in data staging Data Warehouse collection of data marts
Independent Data Mart Four basic steps (continue): Data warehouse is a set of physically distinct databases organized for decision support. Contains both detailed and summary data Users access the data warehouse by means of a variety of query languages and analytical tools. Results may be fed back to data warehouse and operational databases.
Data marts: Mini-warehouses, limited in scope L T E Separate ETL for each independent data mart Data access complexity due to multiple data marts Independent data mart data warehousing architecture
Independent Data Mart Several limitations: A separate ETL processes is developed for each data mart Data marts may not be consistent with one another No capability to drill down into greater detail or into related facts in other data marts Scaling costs are excessive because every new application, which creates a separate data mart, repeats all the extract and load steps. Cost to make the separate data marts consistent are quite high.
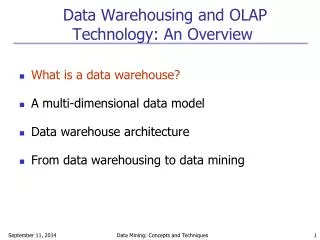
Dependent Data Mart and Operational Data Store Operational Data Store: An integrated, subject-oriented, continuously updatable, current-valued (with recent history), enterprise-wide, detailed database designed to serve operational users as they do decision making Enterprise Data Warehouse (EDW): A centralized, integrated data warehouse that is the control point and single source of all data made available to end users for decision support applications Dependent Data Mart (from EDW): A data mart filled exclusively from the enterprise data warehouse and its reconciled
ODS provides option for obtaining current data L T E Simpler data access Dependent data marts loaded from EDW Single ETL for enterprise data warehouse (EDW) Dependent data mart with operational data store:a three-level architecture
Logical Data Mart and Real-Time Data Warehouse Logical data mart: A data mart created by a relational view of a data warehouse. Real-Time Data Warehouse: An enterprise data warehouse that accepts near-real-time feeds of transactional data from the systems of record, analyzes warehouse data, and in near-real-time relays business rules to the data warehouse and systems of record so that immediate action can be taken in response to business events.
ODS and data warehouse are one and the same L T E Data marts are NOT separate databases, but logical views of the data warehouse Easier to create new data marts Near real-time ETL for Data Warehouse Logical data mart and real time warehouse architecture
Three-Layer architecture Operational data are stored in the various operational systems of record throughout the organization Reconciled data are the type of data stored in the enterprise data warehouse and an operational data store Reconciled data: detailed, current data intended to be the single, source for all decision support applications Derived data are the type of data stored in each of the data marts Derived data: data that have been selected, formatted and aggregated for end-user decision support applications.
Three-Layer architecture: Role of the Enterprise Data Model Enterprise Data Model: Presents a total picture explaining the data required by an organization. Reconciled Data: must conform to the design specified in the EDM EDM: controls the phased evolution of the DW
Three-Layer architecture: Role of Metadata Metadata: technical and business data that describe the properties or characteristics of other data Operational metadata Describe the data in the various operational systems (including the external data) that feed the EDW EDW metadata Derived from EDM. Describe the reconciled data layer as well as the rules for extracting, transforming and loading operational data into reconciled data Data mart metadata Described the derived data layer and the rules for transforming reconciled data to derived data
Data Characteristics: Status vs. Event Data Status Status Example of DBMS log entry Event = a database action (create/update/delete) that results from a transaction
Data Characteristics: Transient vs. Periodic Data Transient operational data With transient data, changes to existing records are written over previous records, thus destroying the previous data content
Data Characteristics: Transient vs. Periodic Data Periodic warehouse data Periodic data are never physically altered or deleted once they have been added to the store
Derived Data Objectives Ease of use for decision support applications Fast response to predefined user queries Customized data for particular target audiences Ad-hoc query support Data mining capabilities Characteristics Detailed (mostly periodic) data Aggregate (for summary) Distributed (to departmental servers) Most common data model = dimensional model (usually implemented as a star schema)
The Star Schema • A simple database design in which dimensional data are separated from fact or event data. • A dimensional model: another name for star schema • Suited ad hoc queries • Not suited to online transaction processing: not used in operational systems, operational data stores or an EDW.
Components of a star schema Fact tables contain factual or quantitative data 1:N relationship between dimension tables and fact tables Dimension tables are denormalized to maximize performance Dimension tables contain descriptions about the subjects of the business Excellent for ad-hoc queries, but bad for online transaction processing
Star schema example Fact table provides statistics for sales broken down by product, period and store dimensions
Issues Regarding Star Schema • Surrogate Keys • Dimension table keys should be surrogate (non-intelligent and non-business related), because: • Business keys may change over time • Helps keep track of nonkey attribute values for a given production key • Surrogate keys are simpler and shorter • Surrogate keys can be same length and format for all key
Issues Regarding Star Schema • Grain of the Fact Table • Granularity of Fact Table–what level of detail do you want? • Transactional grain–finest level • Aggregated grain–more summarized • Finer grains better market basket analysis capability • Finer grain more dimension tables, more rows in fact table • In Web-based commerce, finest granularity is a click
Issues Regarding Star Schema • Duration of the Database • Natural duration–13 months or 5 quarters • Financial institutions may need longer duration • Older data is more difficult to source and cleanse
Size of Fact Table • Depends on the number of dimensions and the grain of the fact table • Number of rows = product of number of possible values for each dimension associated with the fact table • Example: assume the following for Figure A: • Total rows calculated as follows (assuming only half the products record sales for a given month):
Size of Fact Table • Estimate the size(in bytes) for fact table: Sales • 6 fields – each four bytes • Total size of the fact table: • Total size = 120,000,000 rows x 6 fields x 4 bytes/field = 2,880,000,000 bytes @ 2.88 gb • Total rows (month) • Total rows (daily) • Total rows = 1000 stores x 5000 active products x 720 days = 3,600,000,000 rows
Variations of the Star Schema • Multiple Facts Tables • Can improve performance • Often used to store facts for different combinations of dimensions • Conformed dimensions: one or more dimension tables associated with two or more fact tables for which the dimension tables have the same business meaning and primary key with each fact table.
Variations of the Star Schema • Factless Facts Tables • No nonkey data, but foreign keys for associated dimensions • Used for: • Tracking events • Inventory coverage
The User Interface • Tools to query and analyze data stored in data warehouses and data marts: • Traditional query and reporting tools • Online Analytical Processing (OLAP), MOLAP, ROLAP • Data Visualization Tools • Data visualization–representing data in graphical/multimedia formats for analysis • Data Mining Tools • Data Mining -Knowledge discovery using a blend of statistical, AI, and computer graphics techniques
The User InterfaceMetadata (data catalog/data directory) • Identify subjects of the data mart • Identify dimensions and facts • Indicate how data is derived from enterprise data warehouses, including derivation rules • Indicate how data is derived from operational data store, including derivation rules • Identify available reports and predefined queries • Identify data analysis techniques (e.g. drill-down) • Identify responsible people
Online Analytical Processing (OLAP) Tools • The use of a set of graphical tools that provides users with multidimensional views of their data and allows them to analyze the data using simple windowing techniques • General term for several categories of data warehouse and data mart access tools. • Relational OLAP (ROLAP) • Traditional relational representation • Use variations of SQL and view the database as a traditional relational database • Multidimensional OLAP (MOLAP) • Cube structure • Load data into an intermediate structure , usually a three or higher dimensional array (hypercube)
Online Analytical Processing (OLAP) Tools • OLAP Operations • Cube slicing–come up with 2-D view of data
Online Analytical Processing (OLAP) Tools • OLAP Operations • Drill-down–going from summary to more detailed views Starting with summary data, users can obtain details for particular cells