Download
1 / 41
420 likes | 545 Views
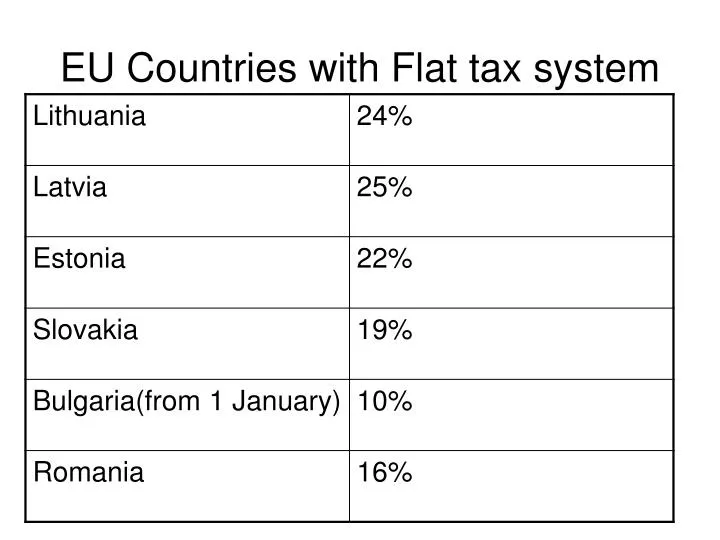
EU Countries with Flat tax system. POPULATION AND SIZE. ESTONIA Population: 1,341 mill. Area: 45,226 sq km . LATVIA Population: 2,271 mill. Area: 64,589 sq km. RUSSIA Population: 142.2 mill. (2007) Area: 17,075,200 sq km. LITHUANIA Population: 3,366 mill. Area: 65,200 sq km .

E N D
POPULATION AND SIZE ESTONIA Population: 1,341 mill. Area: 45,226 sq km LATVIA Population: 2,271 mill. Area: 64,589 sq km RUSSIA Population: 142.2 mill. (2007) Area: 17,075,200 sq km LITHUANIA Population: 3,366 mill. Area: 65,200 sq km KALININGRAD OBLAST Population: 947,000 Area: 15,100 sq km BELARUS Population: 9.685 mill. (June 2008) Area: 207,600 sq km POLAND Population: 38.5 million (2008) Area: 312,685 sq. km
INFLIATION 12.6% (Jan 2008) 11.3%* 17.9%* 12%* 9.3% (8/2007) 8.4% (2007 est) 2.5% (2007) *LT, LV, EE – May 2008
UNEMPLOYMENT RATE 4.2%* 6.2% 6.5% 4.9% 5.9% (Jan. 2007) 1.7% (2007) 12.8% (2007 est.) *LT, LV, EE – Q1 2008
Average gross monthly earnings (2007) in Euros 788 EUR* 375 EUR 645 EUR 623 EUR 348 EUR 268 EUR 770 EUR (9/2007) *Q1 2008 (LT, LV, EE)
GDP GROWTH 7.1% 8.1% 10.3% 8.8% 11.2%* 8 % 6.5% (est.) *2006 Q1 2008 - EE 0.1%; LV 3.3%; LT 7%
GDP per Capita (2007 est.)* $21,100 $14,700 $17,400 $17,700 $10,900 $16,300 *CIA- The World Factbook
Expenditure on social protection as a percentage of GDP (2004)
Lithuania – Human Development Index • Lithuania ranks at 43 in the United Nations Development Programme (UNDP) Human Development Index. Estonia ranks at 44 and Latvia ranks at 45. • HDI - living a long and healthy life (measured by life expectancy), being educated (measured by adult literacy and enrolment at the primary, secondary and tertiary level) and having a decent standard of living (measured by purchasing power parity, PPP, income). • At ranking 43 out of 177 countries – Lithuania is listed as - a ‘High Human Development Country’.
Index of Fatal Accidents at Work 1998-2005 (per 100,000 employees)source: Eurostat
Fatal accidents at work Index of the number of fatal accidents at work per 100 thousand persons in employment (1998=100)
Food and non-alcoholic beverages (% of household income expenditure) 2005
Inequality of income distribution (income quintile share ratio) 2005
Relation between income inequality and life expectancySource: HEALTH STATUS AND LIVING CONDITIONS IN AN ENLARGED EUROPE Report prepared by European Observatory on the Social Situation LOT 4: Health Status and Living Conditions Network for the DG Employment, Social Affairs, and Equal Opportunities, European Commission Final Report December 2005 p.64 http://ec.europa.eu/employment_social/social_situation/docs/sso2005_healthlc_report.pdf
Recent demographic developments in Europe 2004. Strasbourg: Council of Europe Publishing 2005
Net trade union density in EU25, 1995–2004 (%)Source: European Foundation, Industrial Relations in EU Member States 2000-2004 p.6.
Collective bargaining coverage in EU25, 2002 (%)Source: European Foundation, Industrial Relations in EU Member States 2000-2004 p.14.
Trade unionisation in the Baltic States • Latvia –15% of workforce (EIRO report. 2005) • Lithuania – 10% of the workforce (EIRO report, 2005) • Estonia –9% of the workforce (LFS, 2006)
Density rate of employer organisations in EU25 (%)Source: European Foundation, Industrial Relations in EU Member States 2000-2004 p.12.
Average number of working days not worked due to strike action per 1,000 employees, EU25, 2000–2004Source: European Foundation, Industrial Relations in EU Member States 2000-2004 p.23.
Did your employer provide cash-in-hand payments for overtime or other work in the last twelve months?
Scale of labour outflow since EU accession in 2004 • Lithuania (3.3%) and Latvia (2.4%) registered outflow of working age population. • In Slovakia, Poland and Estonia, the scale of outflow was somewhat smaller – about 1% • LABOR MIGRATION FROM THE NEW EU MEMBER STATES: World Bank, EU8,Quarterly Economic Report, PART II: Special Topic, September 2006,World Bank Report p.22
Proportion of people who think that they are likely to move to another EU Member State in the next five years (percentages)
Proposals of World Bank • Governments would be well-advised to manage labor migration more proactively. • Further measures are needed to stimulate labor force participation and employment, including reducing high labor taxes and in some cases social benefits. • EU8 countries should also consider phasing in—in tandem with capacity development for screening needed labor—a more liberal regime for importing labor from countries further east.