Download
1 / 1
10 likes | 214 Views
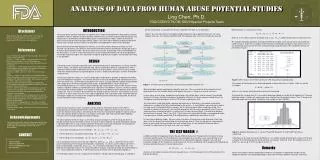
Analysis of DATA From Human Abuse Potential Studies. Ling Chen, Ph.D. FDA/CDER/OTS/OB/ DBVI/Special Projects Team. Mathematically, it is equivalent to testing: vs. where M P is the median response of placebo, and is called the equivalence margin of the test.

E N D
Analysis of DATA From Human Abuse Potential Studies Ling Chen, Ph.D. FDA/CDER/OTS/OB/ DBVI/Special Projects Team Mathematically, it is equivalent to testing: vs. where MP is the median response of placebo, and is called the equivalence margin of the test. We studied the placebo distribution for Drug Liking VAS on a bipolar scale using 8 human abuse potential studies in house. Under the assumption of the normality of the placebo distribution, meta analysis [10, 11] was performed, and results for the mean of Emax of Drug Liking VAS and its 95% confidence interval are presented in Figure 2. positive control drug, CH; low-dose test drug, TL; high-dose test drug, TH; and placebo, P. Figure 1 gives the flow chart of the multiple testing procedure for abuse potential measures. For some negative measures, for example, Bad Effect VAS, the inequality signs in the testes need to be reversed. INTRODUCTION Disclaimer The human abuse potential study plays an important role in understanding whether a drug produces positive subjective responses indicative of abuse potential. However, the assessment of abuse potential of drugs also includes (but is not limited to) receptor binding studies, animal behavioral studies, and the evaluation of adverse events that occur during clinical efficacy studies. The human abuse potential study along with these related studies provide the basic contents of Drug Abuse and Dependence section of the drug label. Since FDA released the Draft Guidance for Industry: Assessment of Abuse Potential of Drugs [1], FDA received many questions and comments from the pharmaceutical industry regarding the design and analysis for human abuse potential studies. This presentation will lay out the study design, and the methodologies for the data analysis, as well as a new equivalence test for the comparison between a test drug and placebo in human abuse potential studies. The equivalence margin for drug liking on a bipolar visual analog scale (VAS) is also provided. This presentation reflects the views of the author and should not be construed to represent FDA’s views or policies. References [1] U.S. FDA Draft Guidance for Industry (2010) : Assessment of Abuse Potential of Drugs. [2] Chen L. , Tsong, Y. (2007). Design and Analysis for Drug Abuse Potential Studies: Issues and Strategies for Implementing a Crossover Design. Drug Information Journal. 41: 481-489. [3] Williams E. J. (1949). Experimental Designs Balanced for the Estimation of Residual Effects of Treatments. Australian Journal of Scientific Research. 2: 149-168. [4] Senn, S. (2002). Cross-over Trials in Clinical Research. Wiley. [5] Chen L. (1995). Testing the Mean of Skewed Distributions. Journal of the American Statistical Association, 37(3): 313-322. [6] Millard S.P., Neerchal N.K. (2001). Environmental Statistics with S-Plus. CRC Press LLC, London. [7] U.S. Environmental Protection Agency’s Guideline for Testing the Mean of Skewed Distributions (Guidance for Data Quality Assessment (QA/G-9)). [8] Chen L. (2011). Abuse Potential Evaluation on Subjective responses to Drug Liking VAS – Issues and Strategies. The 2nd International Society of Biopharmaceutical Statistics symposium. (Presentation) [9] Chen L., Bonson K.R (2011). An Equivalence Test for the Comparison between a Test Drug and Placebo in human abuse potential studies, accepted by Journal of Biopharmaceutical Statistics for publication. [10] Kulinskaya, E., Morgenthaler, S., Staudte, R. G. (2008). Meta Analysis: A Guide to Calibrating and Combining Statistical Evidence. Wiley. [11] Whitehead, A. (2003). Meta-Analysis of Controlled Clinical Trials. Wiley. DESIGN The design of the human abuse potential study should be based on the study objective(s) and the statistical analysis model. The human abuse potential study requires collecting of data over a period of time after a single dose administration to determine the time course of the drug effects. Doses of the test drug should range from minimally effective to supratherapeutic, if safety is known and precautions are taken to deal with safety concerns. Human abuse potential studies are usually a double blind, double dummy, placebo, and positive controlled, crossover designed investigation. The washout period of a crossover designed study should be at least five times the maximum t1/2 of the longest acting drug in the study [1, 2]. Drug conditions typically involve placebo and multiple doses of the test drug and positive control. A repeated Williams square design [3] is recommended, because it is a variance balanced design and it also balances the first order carryover effects. Subjects should be randomly assigned to one of the sequences in the Williams square(s) so that all subjects are tested under all drug conditions. The number of replicates of the Williams square depends on the desired sample size. The assessment of abuse potential may include co-primary measures and secondary measures of interest, as well as other measures in the study, if appropriate. The study needs to be sufficiently powered with proper sample size not only for the comparison between positive control drug and placebo, but also for the consideration of other comparisons. Figure 2. Meta-analysis on the mean of Emax of VAS-Drug Liking in placebo group The variance of the placebo was estimated by pooled variances from these 8 studies. Under the normal assumption, where σP is the square root of the pooled variance of the placebo. To estimate the standard error of , we used the bootstrap method to simulate the distribution of . For each bootstrap sample, 8 studies with replacement were selected from the 8 original studies. Then based on this bootstrap sample was calculated. The Monte Carlo sample size was 100,000. Figure 1. Theflow chart of comparisons in human abuse potential studies (A→B) We evaluate both positive and negative subjective measures. Our assessment of abuse potential of a test drug, based on results from both positive and negative measures, is made on a case by case basis. In some cases of novel drugs, two positive control drugs with multiple doses may be needed. For extended release of C-II drugs, and other formulations for deterrent effects on C-II drugs, sponsors should discuss the strategies of evaluation procedures with the CSS, before conducting the trials. The mixed effects model with period, sequence and treatment as fixed effects, and subject nested within sequence as a random effect [4] is recommended for the analysis. If a non-Williams square design is used or the study results in incomplete Williams squares, the first-order-carryover effects need to be tested. If the normality assumption in the model is not satisfied, descriptive statistics may be provided to show if there are sequence effects or/and period effects, as well as the first-order-carryover effects. If the difference between two treatments is skewed, Chen’s t-test [5, 6, 7] for the mean of a skewed distribution is recommended, before a non-parametric method is performed. All testing procedures should be pre-specified in the SAP. In human abuse potential studies, there are at least two doses of the positive control drug, and at least two doses of the test drug. A hierarchical order for testing the low dose first then the high dose is recommended, because even though there are multiple tests and multiple doses, if a pre-specified hierarchical order is arranged, the adjustment for the type I error rate is not needed. ANALYSIS • Data from abuse potential studies should be carefully analyzed. A Statistical Analysis Plan (SAP) is encouraged to be submitted to the FDA for review. The primary endpoint of interest usually is Emax - the maximum response during 8 hours after dosing or the maximum of change from predose response during 8 hours after dosing if predose response is meaningful, for example, High VAS and ARCI MBG (Addiction Research Center Inventory Morphine Benzedrine Group). • The abuse potential of the test drug is assessed by comparing responses of the test drug with those of placebo and with those of the positive control. A result of no abuse potential should be validated by showing a significant difference in mean responses between the positive control and the placebo. For each positive abuse potential measure of interest, the following tests are recommended: • The positive control drug versus the placebo: • The test drug versus the positive control drug: • The test drug versus the placebo: with a significance level of 2.5% for the one-sided tests, where , and denote the means of the positive control drug, the test drug and the placebo, respectively, and are the medians of the test drug and the placebo, respectively, and is called an equivalence margin, where is the third quartile of placebo response. For Drug Liking VAS on a bipolar scale from 0 to 100, the recommended is 11. How to obtain this margin of 11 will be discussed in the section of “The Equivalence Margin ”. For illustration purpose, assume a study with five treatments, low-dose positive control drug, CL; high-dose Acknowledgements The author thanks Dr. Stella G. Machado, the Division Director of DBVI, and Dr. Michael Klein, the Director of the CSS, for their helpful comments on this presentation. THE TEST MARGIN Figure 3. Empirical Distribution of , where P5 and P95 denote the 5th and the 95th percentiles, respectively. From Figure 3, one may see that the distribution of is slightly skewed to the left with a mean of 10.55 and a median of 10.59. Ninety percent of the estimates are between 10.07 and 10.94. The standard error of is 0.29. Thus, we set up 11 for the margin of the test, . CONTACT In 2009 and 2010, the Regulatory Science Review (RSR) Enhancement Program within the Center for Drug Evaluation and Research at the FDA granted a research project to re-examine issues and to develop a new assessment criterion for the comparison between the test drug and the placebo. Detailed issues with past evaluation methods for this comparison can be found in [8, 9]. Chen and Bonson (2011) proposed the following test for abuse potential measures on visual analog scales: vs. where MTis the median response of the test drug and the Q3P is the third quartile (or the 75th percentile) of the placebo distribution. Corinne Moody CSS/OD/CDER/FDA corinne.moody@fda.hhs.gov 301-796-5402 Remarks Further meta-analyses will be conducted to extend this investigation on equivalence margins for the comparison between a test drug and placebo on other abuse-related subjective measures at the FDA.