Download
1 / 23
240 likes | 343 Views
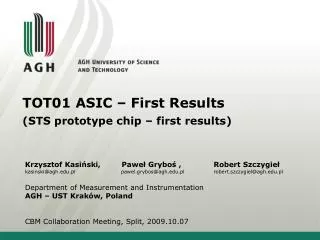
First test results of TOT01 ASIC prototype. Krzysztof Kasi ń ski , Paweł Gryboś , Robert Szczygieł kasinski@agh.edu.pl pawel.grybos@agh.edu.pl robert.szczygiel@agh.edu.pl Department of Measurement and Instrumentation

E N D
First test results ofTOT01 ASIC prototype Krzysztof Kasiński, Paweł Gryboś , Robert Szczygieł kasinski@agh.edu.pl pawel.grybos@agh.edu.pl robert.szczygiel@agh.edu.pl Department of Measurement and Instrumentation AGH – UST Kraków, Poland15thCBM CollaborationMeeting, GSI, Darmstadt, 12 – 16April 2010
Agenda Chip overview Measurement results Plans for the future Summary
Chip Overview - specification Specification: • UMC 180 nm technology, (Europractice run 01.06.2009 1.6x3.2mm die) • input charge: 1-16fC (both polarities, much higher charges allowable) • 31 channels (30 regular + 1 test) • Time-over-Threshold (ToT) amplitude measurement method • Low Power (~2.3 mW/channel -> CSA + Discriminator) • Designed for Si Strip Detectors (30pF, 300 um thick, AC-coupled) • Target resolution: 4-6 bits • Noise: ~500 e- (@30pF) See next slides ! Channel pitch: 50um Detector pad pitch: 100um Die size: 1.6 x 3.2 mm TOT01 Chip Layout
Measurement idea – set-up capabilities - Observation of the output pulses during in a specified “observation window” • programmable observation time • fixed time resolution 20ns (issue!) Retrieved information contains: • number of pulses • timestamp of each pulse • width of each pulse • µ and σ of pulse widths CSA output Discriminator output
Preliminary X-ray measurement Molybdenum X-ray tube (45kV, 2mA, avg. 6.5 kHz int. rate) Theoretic: 17,4 keV -> 4731 e- -> 0.75 fC Measured: 5386 e- -> 0.839 fC
Measurement preface • 2 modes (discharge current): • FAST <-! • SLOW Actual discharge time depends also on the threshold setting! • Detector capacitances measured: • 0.5 pF (channel itself) • 4 pF (channel bonded to the 2cm detector) • 28 pF (channel + 2cm detector + 2x12 pF capacitors bonded to the adjacent strips)
Threshold scan measurements SLOW DISCHARGE FAST DISCHARGE
ToT scan measurements – 1 0.5 pF, SLOW 0.5 pF, FAST 4 pF, SLOW 4 pF, FAST
ToT scan measurements: 28pF Approx. Effective Threshold ToT charactieristics for various thresholds Gain evolution [ns/fC] Close to the rice 0.8 fC 1 fC 1.5 fC 1.8 fC 2 fC 3 fC 4 fC 5 fC • Observations: • All reach gain of ~100ns/fC • disturbance for 8mV threshold • (rice border!) • - Nonlinearity close to the threshold [mV] What about the noise?
Noise Behavior – 1 28pF σpulse width vs. Qin for various thresholds Close to the rice 5 4 3 2 1.8 1.5 1 0.8 σpulse width [ns] [mV] [fC] Qi [fC]
Noise Behavior – 2 28pF ENC vs. Qin for various thresholds 5 4 3 2 1.8 1.5 1 0.8 ENC [e-] [mV] [fC] Qi [fC] Threshold: ENC (approx.) LSB No. Bits (0-16fC range) 10mV (1fC) 3000 e- 1.66 fC 3.26 15mV (1.5fC) 2000 e- 1.1 fC 3.85 20mV (2fC) 1500 e- 0.83 fC 4.27 50mV (5fC) 1100 e- 0.61 fC 4.71 ENC (thr.scan): 699 e-
Noise Behavior – 3 28pF 2 fC pulse, 8mV thr (0.8 fC) 2 fC pulse, 10mV thr (1 fC) Pulse width: 573 ns σ pulse width: 55 ns Pulse width: 415 ns σ pulse width: 35 ns ENC: 3000 e- ENC: 2184 e- LOW THRESHOLDS! Assuming gain: 100 ns/fC
Noise behavior – 4 28pF 10 fC pulse, 50mV thr (5 fC) Pulse width: 759 ns σ pulse width: 19.5 ns ENC: 1216 e- HIGH THRESHOLD! Assuming gain: 100 ns/fC
ENC vs. Cdet (Threshold scan, ToT scan, Simulation) • ENC ToT calculated for: • circa 2fC pulse, 15mV thr (1.5fC)
Results - summary Threshold Scan ToT Scan 5us/div
Plans for 2010 • Further tests- setup improvements- measurements with X-rays / laser • A prototype for alternate methodes (June/July)- fast gaussian shaping (7-order shaper with complex conjugate poles) + ToT / ADC (an ADC was submitted in April) • A large size prototype that can be used for system tests (end of the year)
System options? Pros: Simpler PCB design, less material • Cons: fast data processing on each F-E chip • Pros: • no high-speed data processing on F-E chip(simpler design, easier to test) • More complex PCB • „Divide and conquer”? • Cons: • yet another chip to design • More complex PCB • Fast serializers on chip? OR • Separate data aggregating chip on each module? What can we learn from other experiments? GBT, Kchip, others...
Thank you for Your attention ? Questions, suggestions, comments? Krzysztof Kasiński, kasinski@agh.edu.pl Robert Szczygieł, robert.szczygiel@agh.edu.pl Paweł Gryboś, pawel.grybos@agh.edu.pl AGH University of Science and Technology Kraków, Poland