Download
1 / 24
250 likes | 327 Views
Performance Management. Objectives. After completing this lesson, you should be able to do the following: Use Enterprise Manager to monitor performance Tune SQL by using the SQL Tuning Advisor Tune SQL by using the SQL Access Advisor Use Automatic Shared Memory Management (ASSM)

E N D
Objectives • After completing this lesson, you should be able to do the following: • Use Enterprise Manager to monitor performance • Tune SQL by using the SQL Tuning Advisor • Tune SQL by using the SQL Access Advisor • Use Automatic Shared Memory Management (ASSM) • Use the Memory Advisor to size memory buffers • View performance-related dynamic views • Troubleshoot invalid and unusable objects
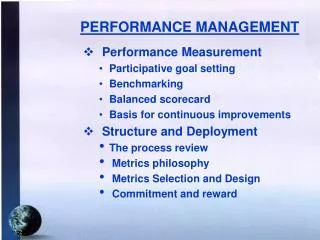
> Perf Mon Tuning Adv Access Adv Memory Stats Invalid Obj Performance Monitoring Memory allocation issues Resource contention Input/output device contention ? Network bottlenecks Application code problems DBA
Perf Mon > Tuning Adv Access Adv Memory Stats Invalid Obj SQL Tuning Advisor: Overview Comprehensive SQL tuning Automatic Tuning Optimizer Statistics check optimization mode Detect stale or missing statistics Plan tuning optimization mode Tune SQL plan (SQL profile) Add missing index Run access advisor Access analysis optimization mode SQL Tuning Advisor SQL analysis optimization mode Restructure SQL
Using the SQL Tuning Advisor • Use the SQL Tuning Advisor to analyze SQL statements and obtain performance recommendations. • Sources for SQL Tuning Advisor to analyze • Top SQL: Analyzes the top SQL statements currently active • SQL Tuning Sets: Analyzes a set of SQL statements you provide • Snapshots: Analyzes a snapshot • Baselines: Analyzes a baseline
SQL Tuning Advisor: SQL Statistics select count(*) from x where object_id < 340 select count(*) from x where object_id < 220 Each statement causes a hard parse.
SQL Tuning Advisor:Identifying Duplicate SQL Bind variable candidates
Perf Mon Tuning Adv > Access Adv Memory Stats Invalid Obj Using the SQL Access Advisor
Perf Mon Tuning Adv Access Adv > Memory Stats Invalid Obj Managing MemoryComponents • Automatic Shared Memory Management: • Is recommendedto simplify management • Enables you to specify the total SGA memory through one initialization parameter • Enables the Oracle server to manage the amount of memory allocated to the shared pool, Java pool, buffer cache, streams pool, and the large pool • Manually setting shared memory management: • Sizes the components through multiple individual initialization parameters • Uses the Memory Advisor to make recommendations
Enabling Automatic SharedMemory Management (ASMM) Click Enable to enable Automatic Shared Memory Management.
V$SESSTAT • sid • statistic# • value • … • Access Adv • Memory • > Stats • Invalid Obj Dynamic Performance Statistics Systemwide Session specific Service specific V$SYSSTAT • statistic# • name • class • value • stat_id V$SERVICE_STATS • service_name_hash • service_name • stat_id • stat_name • value V$SERVICE_EVENT • service_name • service_name_hash • event • event_id • total_waits • total_timeouts • time_waited • average_wait • time_waited_micro V$SYSTEM_EVENT • event • total_waits • total_timeouts • time_waited • average_wait • time_waited_micro V$SESSION_EVENT • sid • event • total_waits • total_timeouts • time_waited • average_wait • max_wait • time_waited_micro • event_id Cumulative stats Waitevents
Troubleshooting and Tuning Views Instance/Database V$DATABASE V$INSTANCE V$PARAMETER V$SPPARAMETER V$SYSTEM_PARAMETER V$PROCESS V$BGPROCESS V$PX_PROCESS_SYSSTAT V$SYSTEM_EVENT Disk V$DATAFILE V$FILESTAT V$LOG V$LOG_HISTORY V$DBFILE V$TEMPFILE V$TEMPSEG_USAGE V$SEGMENT_STATISTICS Contention V$LOCK V$UNDOSTAT V$WAITSTAT V$LATCH Memory V$BUFFER_POOL_STATISTICS V$LIBRARYCACHE V$SGAINFO V$PGASTAT
Perf Mon Tuning Adv Access Adv Memory Stats > Invalid Obj Invalid and Unusable Objects • Effect on Performance: • PL/SQL code objects are recompiled. • Indexes are rebuilt.
Summary • In this lesson, you should have learned how to: • Use Enterprise Manager to monitor performance • Tune SQL using the SQL Tuning Advisor • Tune SQL using the SQL Access Advisor • Use Automatic Shared Memory Management • Use the Memory Advisor to size memory buffers • View performance-related dynamic views • Troubleshoot invalid and unusable objects
Practice Overview:Monitoring and Improving Performance • This practice covers the following topics: • Detecting and repairing unusable indexes • Using the SQL Tuning Advisor • Using the Performance page in Enterprise Manager