Download
1 / 69
710 likes | 954 Views
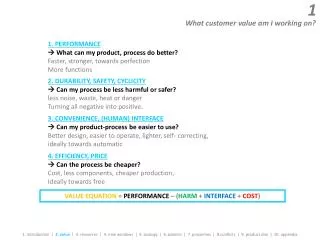
Harder, Better, Faster, Stronger. Semi-Auto Vulnerability Research. Professional Vulnerability Research. Finding bugs is not the problem Fuzzing works Microsoft found over 1800 bugs in Office 2010

E N D
Harder, Better, Faster, Stronger Semi-Auto Vulnerability Research
Professional Vulnerability Research • Finding bugs is not the problem • Fuzzing works • Microsoft found over 1800 bugs in Office 2010 • http://blogs.technet.com/b/office2010/archive/2010/05/11/how-the-sdl-helped-improve-security-in-office-2010.aspx • 280 bugs found in Mozilla JavaScript using JSFunFuzz • https://bugzilla.mozilla.org/show_bug.cgi?id=jsfunfuzz • Tooling is not the problem • Distributed fuzzing • Crash analyzers • Lack of intelligent workflow is the problem
Main Goal Develop an effective workflow and toolset for fuzzing and triaging vulnerabilities in a production environment
Ancillary Goals • Primary • Determine cause and exploitability • Human time efficiency • Secondary • CPU efficiency • Ease of use
Keys to Fuzzing Smartly • Input selection • Most important factor in timely bug discovery • Time management • Automation • SIMPLE Distributed fuzzing • Crash analysis • Bucketing • Confidence Rating
Keys to Smart Bug Triage • Crash selection • Select for understanding • Crash database • Bug classes • Program flow analysis • Code coverage • Input Mapping • Taint Analysis
Input Selection • Attack Surface Analysis • Determine which areas of the code are reachable from external inputs • Template code coverage • Determine what areas of code are exercised by different templates • Rank templates based upon coverage of targeted code or overall attack surface
Fuzzing The Miller Theorem C = code path coverage T = Time spent Fuzzing B = Bugs Discovered
Fuzzing • Obey the Miller Theorem • Create inputs to maximize coverage • Create the framework to maximize uptime • Generation vs. Mutation • If you can, do both! • Mutation is cheaper, still works • Do as little work as possible • Re-do as little work as possible
Fuzzing – Test Execution • Watch your tests well • Embedded custom debugger • Be able to gather needed data at crash time • Make use of debugging technologies • Be able to avoid invalid exceptions • Distribute your tests • Centralized management • Make it easy to add nodes
Fuzzing – Data Storage • Use a database! • Store lots of data over time • Easily searched • What to store • Store what you need for crash selection • All crash information • Software versioning information • Binary diffs
Fuzzing - Retesting • Maintaining a good database allows: • Automated retesting of modified code paths • Automated retesting of crashes in modified code paths • Track bug life across software versions • A bug which lives through a nearby patch can have a long shelf-life • MS08-067 and MS06-040 • ANI
Triage – Crash Selection • Which crashes should receive priority? • What properties make crashes more exploitable? • Knowledge! Familiarity! • Crash database • Vulnerability properties • Searchable crash criteria
Triage – Crash Selection • Exception Analysis • Determine level of access exception grants user • Bug Class Identification • Difficulty of exploitability varies by bug class • Custom architecture problems • Custom memory allocators
Triage – Program Flow Analysis • Abstract a program into flows • Code execution • Data dependency • Code Coverage • Block hit trace for path to exception • Build a graph of program execution • Augment static program graphs
Triage – Program Flow Analysis • Input Mapping • Trace APIs or System Calls that perform I/O • Mark data copied from external sources into memory • Taint analysis • Follow input through the execution of the program • Determine where the bytes of the crash originated • Potential for exploit and signature generation
Triage – Program Flow Analysis • Visualization • Provides a graphical representation of program structure and execution paths • Visualization allows overlaying multiple graphs and datasets using visual cues • Converting data to a visual problem allows rapid understanding of large datasets
Input Selection - Requirements • Attack Surface Analysis • Call graph analysis • Template code coverage • Dynamic tracing • Template ranking • Coverage graph analysis
Attack Surface Analysis • Obtain call graph • IDA2Moflow.idc • LibCodis • Define APIs that are data entry points
Attack Surface Analysis • Determine reachability graph from each API δ-wavefront ← RootSet closure ← 〈〉 While nonEmpty(δ-wavefront) Do wavefront ← oneStep(δ-wavefront) δ-wavefront ← wavefront − closure closure ← closure ∪ δ-wavefront End While Return closure δ-wavefront Algorithm – Qadahet al.
Template Code Coverage • Dynamic Tracing • Instrument each basic block in a program • Efficiently record execution order of all blocks • Implementation - PinFlow • Program tracer written as a PinTool • Hook on block cache creation • Inject instructions into cached code blocks • Callback function writes binary struct to ringbuffer • Ringbuffer flushed when full and on program exit
Template Code Coverage • Moflow Visualizer PinFlowTrace Launcher
Template Code Coverage • Advantage – Speed • PIN is much faster than traditional breakpoint or trap based solutions 11.57 times faster!
Template Prioritization • Select functions for attack surface • Calculate reachability to create attack surface graph • Rank stored traces by number of nodes hit in attack surface graph
Template Prioritization [TraceRank.png]
Graph Visualization Moflow Block Trace Graph Visualization [Graph 1]
Fuzzing Automation • Distributed Fuzzing • Fuzzer Management • Data Gathering • Crash Mining
Distributed Fuzzing • Tests are small and atomic • Distribute simply • Make it easy to add systems • Easy to add tests • Centralized Management • Aids in speedy addition of hardware
Fuzzer Management • Customizable yet simple • Ignore first chance exceptions? • Add debugging technologies? • Max test case timeout • Ease of use is key • Quick recovery for dead hosts • Quick addition of new hosts • Centralized management w/ database
Fuzzer Management • Jobs are held in the central DB • Job details passed to workers • Test cases are generated by workers as needed • Successful crashes are returned to the DB with details • Test cases are wrapped with a custom debugger • Data is returned to the central DB
Data Gathering • Store what you must • Bucketing • Categorization • Indicators of Exploitability • Store what you have • Why redo work? • Can’t know what you may need • Store it smart • Database!
Crash Mining • Post-crash analysis is performed on crashes deemed “relevant” • Relevant crashes are those which are: • Familiar to your exploit developers • Relate to your attacking goals • Relevant crashes are mined as needed from the database with queries. • What is relevant changes over time.
Triage - Requirements • Exploitability • Exception information • Deep Trace • Triggering Condition • Fuzzer feedback • Taint analysis • Root Cause • Graph analysis
Triage - Exploitability • Exception Information • Brutefile outputs XML data containing exception information • Deep Trace • Code Coverage • Attack surface APIs • Dataflow
Triage - Exploitability • Dataflow • Once exception is found program is traced using PinFlow to gather instruction level instrumentation • Blocks are hooked during cache and disassembled to instrument instructions that access memory • Dataflow callback function records the address and value of each memory read or write • Taint Analysis • Provides exception analysis functions with information about controlled bytes • Knowledge of controlled bytes allows more precise analysis
Triage – Triggering Condition • Fuzzer Feedback • As part of exception analysis data Brutefile includes information about mutation • Taint analysis • When triaging a bug from input with unknown modifications, perform taint analysis • Forward taint propagation from memory allocated to stored data from input file will reveal which bytes are referenced in the exception
Triage – Root Cause • Graph Analysis • Overlay graphs of several deep traces to determine similarity • If execution trace leading up to the crash is identical but different bytes were manipulated, root cause should be determined • Taint analysis • Follow tainted data in the exception back to the code location that first influenced the memory location with external data
Console Disassembler • Console interface for libcodis • Static Analysis • Instruction Disassembly • Function Detection • Code and Data Cross-References • Function Control Flow Graph • Call Graph • Import IDA2Moflow and .map files
Windbg Integration • CodisExt • Windbg extension using the engextcpp API • Utilizes libcodis to extract disassembly graphs and cross-references • Utilizes Windbg DML functionality to allow a hyperlinked interface for cross references