Download
1 / 31
310 likes | 463 Views
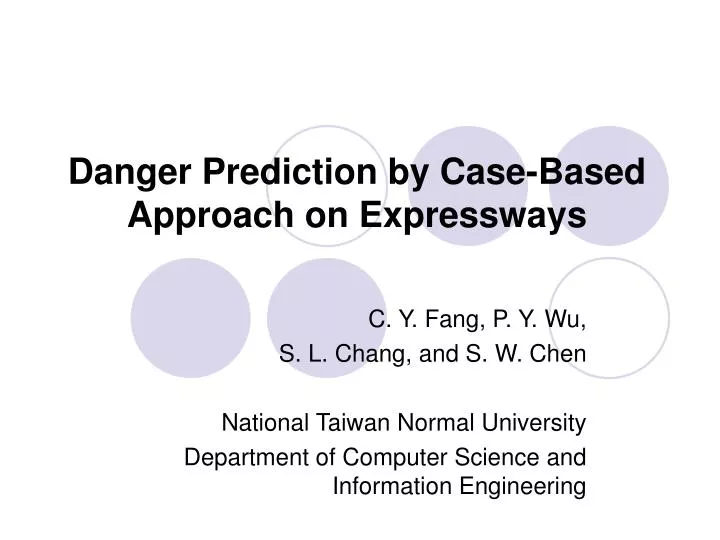
Danger Prediction by Case-Based Approach on Expressways. C. Y. Fang, P. Y. Wu, S. L. Chang, and S. W. Chen National Taiwan Normal University Department of Computer Science and Information Engineering. Outline. Introduction System Flowchart and Database Weighted Relational Map

E N D
Danger Prediction by Case-Based Approach on Expressways C. Y. Fang, P. Y. Wu, S. L. Chang, and S. W. Chen National Taiwan Normal University Department of Computer Science and Information Engineering
IEEE ITSC 2008 Outline • Introduction • System Flowchart and Database • Weighted Relational Map • The Matching Algorithm • Experimental Results • Conclusions and Future Work
IEEE ITSC 2008 Introduction • Driving risk reduction approach • Passive approach • To reduce the degree of injury in case of an accident • Examples: seat belts and airbags • Active approach • To prevent accidents in advance • Example: driver assistance system • The dangerous driving event prediction system • To predict dangerous driving events • Based on the weighted relational map • the driving factors for the host vehicle • the driving factors for nearby vehicles • the driving factors for the roadway conditions
IEEE ITSC 2008 DrivingFactors Relational Map for Driving Event Construction Relational Map of Dangerous Case Database Map C Map D Relational Map Matching Dangerous Case Insertion Degree of Danger Generation yes Map C no no Accident Occurred? Dangerous? yes Warning Output System Flowchart
IEEE ITSC 2008 Dividing Database into Sub-Databases • To speed the matching process • Dangerous case database is divided into four sub-databases based on road conditions. Dangerous CaseDatabase Tunnel Section Sub-Database Tollbooth Section Sub-Database Interchange Section Sub-Database Ordinary Section Sub-Database
IEEE ITSC 2008 Dividing Sub-Database into Classes • Each sub-database is divided into six classes based on weather conditions. Interchange Section Sub-Database Hazy Class Snowy Class Sunny Class Cloudy Class Misty Class Rainy Class
IEEE ITSC 2008 Outline • Introduction • System Flowchart and Database • Weighted Relational Map • The Matching Algorithm • Experimental Results • Conclusions and Future Work
IEEE ITSC 2008 n1 n2 Longitudinal distance Host vehicle n3 Lateral distance Driving Factors • Input data for nearby vehicles • Lateral distance • Longitudinal distance • Relative lateral speed • Relative longitudinal speed • The driving factors for nearby vehicles are: (1) the left-front vehicle and the host vehicle are close (2) the preceding vehicle and the host vehicle are close (3) the right-front vehicle and the host vehicle are close (4) theleft vehicle and the host vehicle are close (5) theright vehicle and the host vehicle are close (6) theleft-rear vehicle and the host vehicle are close (7) thefollowing vehicle and the host vehicle are close (8) theright-rear vehicle and the host vehicle are close
IEEE ITSC 2008 Driving Factors • Input data for host vehicle • Lateral distance to left/right obstacle • Turning angle of front wheel • Turn signal on/off • Speed of host vehicle • Driver’s level of alertness • The driving factors for host vehicle are: (9) the host vehicle turns left (10) the host vehicle turns right (11) the host vehicle speeds up (12) the host vehicle slows down (13) driver’s level of alertness increases (14) driver’s level of alertness decreases (15) the host vehicle turns on the turn signal (16) the host vehicle maintains constant speed (17) the host vehicle goes straight
IEEE ITSC 2008 Driving Factors • Driving factors for roadway: (18) smooth and straight roadway (19) smooth and curved left roadway (20) smooth and curved right roadway (21) downgrade and straight roadway (22) downgrade and curved right roadway (23) downgrade and curved left roadway (24) upgrade and straight roadway (25) upgrade and curved left roadway (26) upgrade and curved right roadway
IEEE ITSC 2008 9 1 18 16 1 11 16 T A Relational Map • Each node represents one driving factor. • Node 18 : smooth and straight roadway • Node 16 : the host vehicle maintains constant speed • Node 1 : the left-front vehicle and the host vehicle are close • Node 11 : the host vehicle speeds up • Node 9 : the host vehicle turns left • Two requirements to generate new nodes • Fixed sampling interval • Any driving factors occurring between samples
IEEE ITSC 2008 1 9 Relational map 18 16 1 11 16 Node number Link weight Node value 0.9 0.9 1 0.5 0.7 0.5 9 0.9 0.7 0.8 0.7 Weighted Relational map 18 16 1 0.4 0.9 0.5 11 0.8 0.7 16 Node number T Weighted Relational Map
IEEE ITSC 2008 The Node Value • The node value (the importance of node) • Initialized with a constant • Increased or decreased based on the relationships with the previous, present and following nodes • Examples of increasing node values • The left-front vehicle and the host vehicle are close at time t -1, and the host vehicle turns left at time t. • The host vehicle speeds up at time t -1, and slows down at time t. • Examples of decreasing node values • The host vehicle turns on the turn signal at time t -1, and turns left at time t. • The host vehicle turns on the turn signal at time t -1, and turns right at time t.
IEEE ITSC 2008 The Weight Between Adjacent Nodes • The link weight: : value of driving factor at : value of driving factor at α : a constant ∆t: the time between successive driving factors • The weight is large if and are very different. • Example: vehicle changes its speed
IEEE ITSC 2008 Outline • Introduction • System Flowchart and Database • Weighted Relational Map • The Matching Algorithm • Experimental Results • Conclusions and Future Work
IEEE ITSC 2008 0.9 0.9 1 0.5 0.7 0.5 9 0.9 0.7 0.8 0.7 Weighted Relational map 18 16 1 0.4 0.9 0.5 11 0.8 0.7 16 T Defining the Driving Factor Sets for Each Node • Three driving factor sets for : • previous, present and following sets • : set for node at time • : set for node at time • : set for node at time
IEEE ITSC 2008 Relationship Between Adjacent Nodes Node value Link weight T
IEEE ITSC 2008 Relationship Between the Nodes on Same Layer Node value T
IEEE ITSC 2008 Table from Weighted Relational Map 0.9 0.9 1 0.5 0.7 0.5 9 0.9 0.7 0.8 0.7 Weighted Relational map 18 16 1 0.4 0.9 0.5 11 0.8 0.7 16 T
IEEE ITSC 2008 Matching Algorithm • Map C is the current weighted relational map formed in real time, and is the driving factor in C. • Map D is the dangerous weighted relational map in the database, is the driving factor in D. • : the similarity between two maps • N:the number of driving factors in C • : the similarity between two driving factors.
IEEE ITSC 2008 Matching Algorithm where | | : scalar cardinality : fuzzy intersection : fuzzy union
IEEE ITSC 2008 Matching Algorithm • : fuzzy driving factor set for node at time in the map C. • : fuzzy driving factor set for node at time in the map D. • T( ) is the weighting function. and are constants.
IEEE ITSC 2008 Outline • Introduction • System Flowchart and Database • Weighted Relational Map • The Matching Algorithm • Experimental Results • Conclusions and Future Work
IEEE ITSC 2008 11 14 1 1 18 9 18 11 1 21 11 9 1 11 21 14 Experimental Results 0.9 0.5 0.5 0.833 0.182 0.2 0.5 0.9 0.833 0.182 Map C 0.957 0.6 0.5 0.444 0.6 0.5 0.9 0.5 0.5 Sim(C,D)=1 0.9 0.5 0.5 0.833 0.182 0.2 0.5 0.9 0.833 0.182 0.957 0.6 0.5 Map D 0.444 0.6 0.5 0.9 0.5 0.5 T 2.0 1.5 1.0 0.5 0.0
IEEE ITSC 2008 Map C3 Sim(C3,D) =0.66 0.9 0.5 0.5 0.833 0.9 Sim(C1,D) =0.48 0.2 0.5 0.9 0.833 0.2 0.5 0.9 0.5 0.9 Map C4 0.957 0.6 Map C2 0.444 0.957 Sim (C4,D)=0.74 Sim(C2,D) =0.65 0.6 0.9 0.5 0.5 0.444 0.957 0.9 0.5 0.833 0.182 0.9 0.2 0.5 0.9 0.833 0.182 21 9 14 1 18 1 18 11 18 1 11 14 1 18 9 9 11 11 1 18 1 0.957 0.6 0.5 Map D 0.444 0.6 0.5 0.9 0.5 0.5 T 2.0 1.5 1.0 0.5 0.0 Example (1) Map C1
IEEE ITSC 2008 0.9 0.5 0.5 0.833 0.182 0.2 0.5 0.9 0.833 0.182 18 9 11 21 1 1 11 14 1 18 11 9 11 21 1 14 0.957 0.6 0.5 Map D 0.444 0.6 0.5 0.9 0.5 0.5 T 2.0 1.5 1.0 0.5 0.0 Example (1) 0.9 0.5 0.5 0.833 0.182 0.2 0.5 0.9 0.833 0.182 Map C5 0.957 0.6 0.5 0.444 0.6 0.5 0.9 0.5 0.5 Sim(C5,D)=1
IEEE ITSC 2008 0.9 0.5 0.5 0.833 0.182 0.2 0.9 0.5 0.9 0.833 0.182 Map D2 0.2 0.5 0.9 11 18 1 9 1 14 18 11 9 1 1 14 1 9 11 18 11 21 0.957 0.6 0.5 Map D1 0.444 0.957 0.444 0.6 0.5 0.9 0.5 0.5 0.9 Example (2) 0.9 0.5 Sim(C,D1)=0.508 0.833 0.2 0.5 0.9 0.833 Map C 0.957 0.6 0.444 0.6 0.9 0.5 Sim(C,D2)=0.743 T 1.5 1.0 0.5 0.0
IEEE ITSC 2008 Sim(C,D1)=0.967 0.9 0.5 0.5 0.211 0.118 0.25 0.5 0.9 0.211 0.118 Map C 0.348 0.2 0.5 0.222 0.9 0.5 0.5 0.316 0.222 0.2 0.5 0.9 0.5 0.5 0.25 0.5 0.9 Sim(C,D2)=0.938 0.9 0.5 0.5 0.842 0.4 0.316 0.222 Map D1 14 21 9 11 1 21 1 14 14 21 1 18 1 1 9 18 9 11 18 11 11 11 1 11 0.25 0.5 0.9 0.348 0.2 0.5 0.842 0.4 0.222 Map D2 0.348 0.2 0.5 0.2 0.5 0.222 0.9 0.5 0.5 0.2 0.5 0.5 0.9 0.5 T Example (3) 2.0 1.5 1.0 0.5 0.0
IEEE ITSC 2008 Sim(C,D1)=0 0.9 0.5 0.5 0.6 0.125 Map C Hit with right-frontvehicle 0.2 0.5 0.9 0.6 0.125 0.4 0.6 0.5 0.444 0.9 0.5 0.5 0.6 0.5 0.9 0.5 0.5 0.6 0.125 Sim(C,D2)=0.081 0.9 0.5 0.5 0.2 0.5 0.9 Map D1 Hit with left-rearvehicle 0.833 0.182 0.6 0.125 1 3 1 9 3 20 10 11 14 14 11 18 11 22 11 21 6 18 9 12 12 21 14 6 0.2 0.5 0.9 Map D2 Hit with left-front vehicle 0.833 0.182 0.4 0.6 0.5 0.957 0.6 0.5 0.444 0.444 0.6 0.5 0.6 0.5 0.9 0.5 0.5 0.9 0.5 0.5 T 2.0 1.5 1.0 0.5 0.0 Example (4)
IEEE ITSC 2008 Conclusions and Future Work • The proposed system • Predicting dangerous driving events based on the weighted relational map which is constructed by the driving factors • Using fuzzy matching algorithm to get the similarity between two weighted relational maps • Future Work • Improving the method to experimental threshold of level of danger • Hoping test vehicles could equip with the prototype system in the future
Thank you for your attention! IEEE ITSC 2008