Download
1 / 20
230 likes | 403 Views
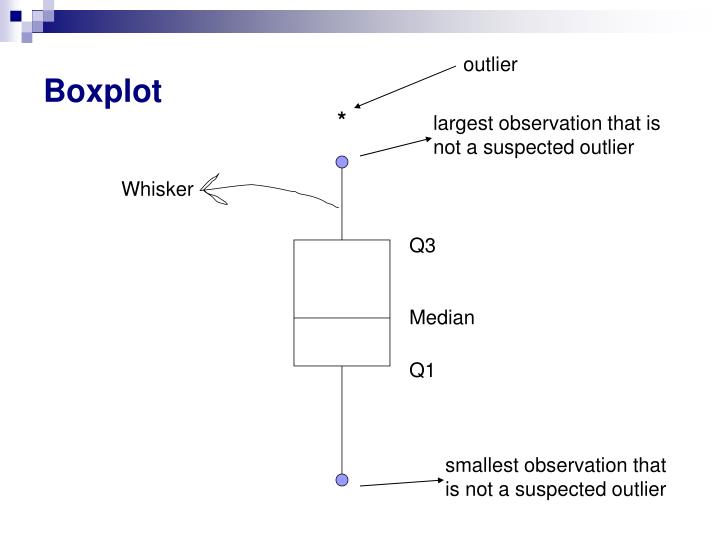
Boxplot. outlier. *. largest observation that is not a suspected outlier. Whisker. Q3. Median. Q1. smallest observation that is not a suspected outlier. Boxplot. May also be represented horizontally:. Whisker. outlier. *. Q1. Median. Q3.

E N D
Boxplot outlier * largest observation that is not a suspected outlier Whisker Q3 Median Q1 smallest observation that is not a suspected outlier
Boxplot May also be represented horizontally: Whisker outlier * Q1 Median Q3 smallest observation that is not a suspected outlier largest observation that is not a suspected outlier
Example The data: “Guess my age” 31 42 27 29 30 27 26 32 36 27 31 30 27 35 31 37 27 27 35 30 25 28 31 20 33 30 34 26 30 33 30 38 34 30 36 35 43 43 35 32 26 37 30 29 27 29 35 26 30 32 32 29 27 30 28 29 36 26 32 32 30 30 27 28 30 26 28 33 35 32 30 28 38 26 29 37 36 32 40
Example The data: “Guess my age” Sorted data - 20 25 26 26 26 26 26 26 26 27 27 27 27 27 27 27 27 27 28 28 28 28 28 29 29 29 29 29 29 30 30 30 30 30 30 30 30 30 30 30 30 30 30 31 31 31 31 32 32 32 32 32 32 32 32 33 33 33 34 34 35 35 35 35 35 35 36 36 36 36 37 37 37 38 38 40 42 43 43
Calculations needed for the boxplot: You may also want to know the mean: Mean = 31.139 Five number summary: Min Q1 M Q3 Max 20 28 30 34 43
Details of calculating median and quartiles Calculating Median: n=79 The median is the observation in position (n+1)/2 = (79+1)/2=40 Median = 30 20 25 26 26 26 26 26 26 26 27 27 27 27 27 27 27 27 27 28 28 28 28 28 29 29 29 29 29 29 30 30 30 30 30 30 30 30 30 30 30 30 30 30 31 31 31 31 32 32 32 32 32 32 32 32 33 33 33 34 34 35 35 35 35 35 35 36 36 36 36 37 37 37 38 38 40 42 43 43
Details of calculating median and quartiles Calculating Q1: Q1 is the median of the first 50% of the data. The first 50% of the data are the first 39 observations (not counting the Median). The median of these observations is the observation in position (39+1)/2=20 Q1 = 28 Q1 20 25 26 26 26 26 26 26 26 27 27 27 27 27 27 27 27 27 28 28 28 28 28 29 29 29 29 29 29 30 30 30 30 30 30 30 30 30 30 30 30 30 30 31 31 31 31 32 32 32 32 32 32 32 32 33 33 33 34 34 35 35 35 35 35 35 36 36 36 36 37 37 37 38 38 40 42 43 43
Details of calculating median and quartiles Calculating Q3: Q3 is the median of the top 50% of the data. The top 50% of the data are the highest 39 observations. Within these 39 observations we look for the median, which is in position 20 Q3 = 34 20 25 26 26 26 26 26 26 26 27 27 27 27 27 27 27 27 27 28 28 28 28 28 29 29 29 29 29 29 30 30 30 30 30 30 30 30 30 30 30 30 30 30 31 31 31 31 32 32 32 32 32 32 32 32 33 33 33 34 34 35 35 35 35 35 35 36 36 36 36 37 37 37 38 38 40 42 43 43 Q3
Now we can draw the “box” 25 26 27 28 29 30 31 32 33 34 35 36 37 38 39 40 41 42 43 44
A criterion for outliers: An observation is marked as a suspected outlier if it falls outside the range: [Q1-1.5xIQR , Q3+1.5xIQR] For the “Guess my age” data IQR=Q3-Q1=34-28=6 1.5*IQR=9 Q1-1.5IQR=28-9=19 (lower fence) Q3+1.5IQR=34+9=43 (upper fence) An outlier is an observation below 19 or above 43
No observations are suspected outliers 2025 26 26 26 26 26 26 26 27 27 27 27 27 27 27 27 27 28 28 28 28 28 29 29 29 29 29 29 30 30 30 30 30 30 30 30 30 30 30 30 30 30 31 31 31 31 32 32 32 32 32 32 32 32 33 33 33 34 34 35 35 35 35 35 35 36 36 36 36 37 37 37 38 38 40 42 43 43
Drawing the whiskers Draw a line to the smallest observation that is not an outlier - 20 Draw a line to the largest observation that is not an outlier - 43 20 25 26 26 26 26 26 26 26 27 27 27 27 27 27 27 27 27 28 28 28 28 28 29 29 29 29 29 29 30 30 30 30 30 30 30 30 30 30 30 30 30 30 31 31 31 31 32 32 32 32 32 32 32 32 33 33 33 34 34 35 35 35 35 35 35 36 36 36 36 37 37 37 38 38 40 42 43 43
Box plot of “Guess my age” data: 20 21 22 23 24 25 26 27 28 29 30 31 32 33 34 35 36 37 38 39 40 41 42 43
Box plot of “Guess my age” data: You may add the mean (as + or ) 20 21 22 23 24 25 26 27 28 29 30 31 32 33 34 35 36 37 38 39 40 41 42 43 Minitab: ..\SURVEY1000.MPJ
Box plot – building blocks • Create a box from quartiles • Add the median (parallel to quartiles) • (add the mean: dot or + in box) • Draw whiskers (lines from box to largest and smallest values within fences) • Observations more than 1.5 x IQR outside the central box are plotted individually as suspected outliers.
Comparative Box plots – “Guess my age “ data for females and males: Minitab: ..\SURVEY1000.MPJ
Example - Boxplot populations of the 10 largest U.S. cities in 1990, in millions. New York 7.323 Los Angeles 3.485 Chicago 2.784 Houston 1.631 Philadelphia 1.586 San Diego 1.111 Detroit 1.028 Dallas 1.007 Phoenix 0.983 San Antonio 0.936
Example - Boxplot Write in ascending order • IQR=2.784-1.007 =1.777 • 1.5*IQR=2.666 • Q1-2.666=<0 • Q3+2.666=5.45 • New York is an outlier • (mean=2.187) San Antonio 0.936 Phoenix 0.983 Dallas 1.007 Detroit 1.028 San Diego 1.111 Philadelphia 1.586 Houston 1.631 Chicago 2.784 Los Angeles 3.485 New York 7.323 Q1=1.007 M=(1.111+1.586)/2=1.349 Q3=2.784
Boxplot of U.S cities populations (in Millions): N.Y. + * 0 1 2 3 4 5 6 7 8
Choosing measures of center and spread • The five number summary (and the boxplot) is usually better than the mean and standard deviation for describing a skewed distribution or a distribution with strong outliers. • Use the mean and standard deviation only for reasonably symmetric distributions that are free of outliers.