Download
1 / 19
190 likes | 266 Views
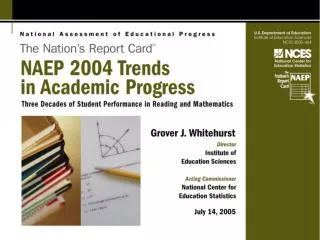
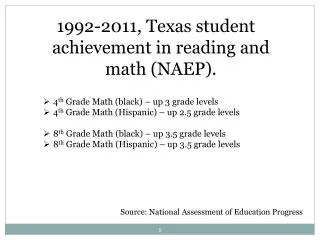
NAEP 2008 Trends in Academic Progress in Reading and Mathematics. National Assessment of Educational Progress. 2. Overview of the 2008 Long-Term Trend Assessment. 3. Reading Results. Trends in National Average Reading Scores. * Significantly different ( p < .05) from 2008.

E N D
NAEP 2008 Trends in Academic Progress in Reading and Mathematics
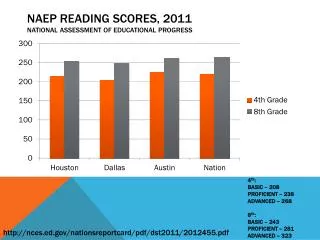
Trends in National Average Reading Scores * Significantly different (p < .05) from 2008. NOTE: The score-point change is based on the difference between unrounded scores. SOURCE: U.S. Department of Education, Institute of Education Sciences, National Center for Education Statistics, National Assessment of Educational Progress (NAEP), various years, 1971–2008 Long-Term Trend Reading Assessments. 5
White – Black Reading Score Gap: Age 9 * Significantly different (p < .05) from 2008. NOTE: Score gaps are calculated based on differences between unrounded average scores. Black includes African American. The White and Black race categories exclude Hispanic origin. SOURCE: U.S. Department of Education, Institute of Education Sciences, National Center for Education Statistics, National Assessment of Educational Progress (NAEP), various years, 1971–2008 Long-Term Trend Reading Assessments. 6
White – Hispanic Reading Score Gap: Age 9 * Significantly different (p < .05) from 2008. 1 Hispanic was not reported as a separate race/ethnicity category in 1971, but data for Hispanic students were included in the overall national results. NOTE: Score gaps are calculated based on differences between unrounded average scores. Hispanic includes Latino. The White race category excludes Hispanic origin. SOURCE: U.S. Department of Education, Institute of Education Sciences, National Center for Education Statistics, National Assessment of Educational Progress (NAEP), various years, 1971–2008 Long-Term Trend Reading Assessments. 7
Reading Results by Race/Ethnicity 1 Results for Hispanic students were first available in 1975. Therefore, the result shown in the 1971 column for Hispanic students is from the 1975 assessment. NOTE: The score-point change is based on the difference between unrounded scores. Black includes African American, and Hispanic includes Latino. Race categories exclude Hispanic origin. SOURCE: U.S. Department of Education, Institute of Education Sciences, National Center for Education Statistics, National Assessment of Educational Progress (NAEP), various years, 1971–2008 Long-Term Trend Reading Assessments. 8
Reading Results by Gender NOTE: The score-point change is based on the difference between unrounded scores. SOURCE: U.S. Department of Education, Institute of Education Sciences, National Center for Education Statistics, National Assessment of Educational Progress (NAEP), 1971, 2004, and 2008Long-Term Trend Reading Assessments. 9
Trends in National Average Mathematics Scores * Significantly different (p < .05) from 2008. NOTE: The score-point change is based on the difference between unrounded scores. SOURCE: U.S. Department of Education, Institute of Education Sciences, National Center for Education Statistics, National Assessment of Educational Progress (NAEP), various years, 1973–2008 Long-Term Trend Mathematics Assessments. 11
White – Black Mathematics Score Gap: Age 9 * Significantly different (p < .05) from 2008. NOTE: Score gaps are calculated based on differences between unrounded average scores. Black includes African American. The White and Black race categories exclude Hispanic origin. SOURCE: U.S. Department of Education, Institute of Education Sciences, National Center for Education Statistics, National Assessment of Educational Progress (NAEP), various years, 1973–2008 Long-Term Trend Mathematics Assessments. 12
White – Hispanic Mathematics Score Gap: Age 9 * Significantly different (p < .05) from 2008. NOTE: Score gaps are calculated based on differences between unrounded average scores. Hispanic includes Latino. The White race category excludes Hispanic origin. SOURCE: U.S. Department of Education, Institute of Education Sciences, National Center for Education Statistics, National Assessment of Educational Progress (NAEP), various years, 1973–2008 Long-Term Trend Mathematics Assessments. 13
Mathematics Results by Race/Ethnicity NOTE: The score-point change is based on the difference between unrounded scores. Black includes African American. The White and Black race categories exclude Hispanic origin. SOURCE: U.S. Department of Education, Institute of Education Sciences, National Center for Education Statistics, National Assessment of Educational Progress (NAEP), 1973, 2004, and 2008 Long-Term Trend Mathematics Assessments. 14
Mathematics Results by Gender NOTE: The score-point change is based on the difference between unrounded scores. SOURCE: U.S. Department of Education, Institute of Education Sciences, National Center for Education Statistics, National Assessment of Educational Progress (NAEP), 1973, 2004, and 2008 Long-Term Trend Mathematics Assessments. 15
Mathematics Coursetaking: Age 13 # Rounds to zero. * Significantly different (p < .05) from 2008. NOTE: Detail may not sum to totals because of rounding. An average score is not shown for students who selected the “not taking mathematics” response because the sample size was insufficient to permit a reliable estimate. SOURCE: U.S. Department of Education, Institute of Education Sciences, National Center for Education Statistics, National Assessment of Educational Progress (NAEP), 1986 and 2008 Long-Term Trend Mathematics Assessments. 16
Mathematics Coursetaking: Age 17 * Significantly different (p < .05) from 2008. NOTE: The “pre-algebra or general mathematics” response category includes “pre-algebra or introduction to algebra” and “general, business, or consumer mathematics” and students who did not take any of the listed courses. The “other” response category includes students for whom the highest-level mathematics course could not be determined due to missing or inconsistent responses. Detail may not sum to totals because of rounding. SOURCE: U.S. Department of Education, Institute of Education Sciences, National Center for Education Statistics, National Assessment of Educational Progress (NAEP), 1978 and 2008 Long-Term Trend Mathematics Assessments. 17