Download
1 / 1
10 likes | 72 Views
TRANSCRIPTIONAL PROFILING OF HUMAN AMNIOTIC FLUID-DERIVED STEM CELLS - WHERE DO THEY RESIDE IN THE DEVELOPMENTAL CONTINUUM? David Mack 1 , Kathryn Gallaher 1 and Stephen J Walker 1 1 Wake Forest Institute for Regenerative Medicine, Winston-Salem, NC, USA. Results. Introduction .

E N D
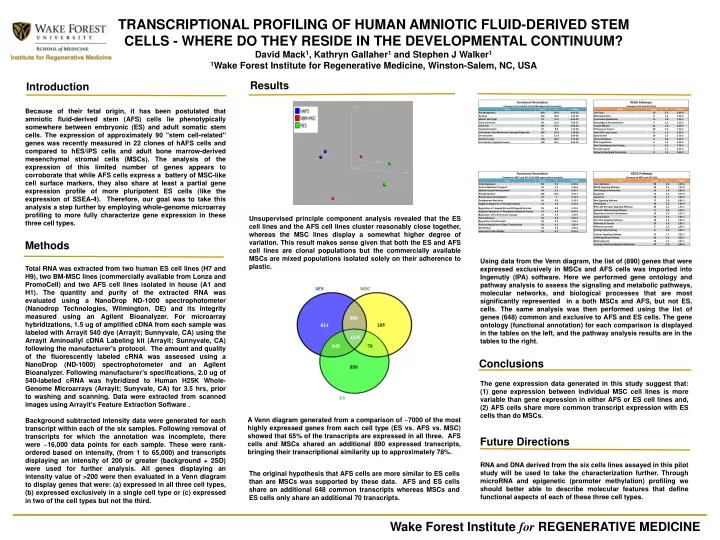
TRANSCRIPTIONAL PROFILING OF HUMAN AMNIOTIC FLUID-DERIVED STEM CELLS - WHERE DO THEY RESIDE IN THE DEVELOPMENTAL CONTINUUM? David Mack1, Kathryn Gallaher1 and Stephen J Walker1 1Wake Forest Institute for Regenerative Medicine, Winston-Salem, NC, USA Results Introduction Because of their fetal origin, it has been postulated that amniotic fluid-derived stem (AFS) cells lie phenotypically somewhere between embryonic (ES) and adult somatic stem cells. The expression of approximately 90 "stem cell-related" genes was recently measured in 22 clones of hAFS cells and compared to hES/iPS cells and adult bone marrow-derived mesenchymal stromal cells (MSCs). The analysis of the expression of this limited number of genes appears to corroborate that while AFS cells express a battery of MSC-like cell surface markers, they also share at least a partial gene expression profile of more pluripotent ES cells (like the expression of SSEA-4). Therefore, our goal was to take this analysis a step further by employing whole-genome microarray profiling to more fully characterize gene expression in these three cell types. D Unsupervised principle component analysis revealed that the ES cell lines and the AFS cell lines cluster reasonably close together, whereas the MSC lines display a somewhat higher degree of variation. This result makes sense given that both the ES and AFS cell lines are clonal populations but the commercially available MSCs are mixed populations isolated solely on their adherence to plastic. Methods Using data from the Venn diagram, the list of (890) genes that were expressed exclusively in MSCs and AFS cells was imported into Ingenutiy (IPA) software. Here we performed gene ontology and pathway analysis to assess the signaling and metabolic pathways, molecular networks, and biological processes that are most significantly represented in a both MSCs and AFS, but not ES, cells. The same analysis was then performed using the list of genes (648) common and exclusive to AFS and ES cells. The gene ontology (functional annotation) for each comparison is displayed in the tables on the left, and the pathway analysis results are in the tables to the right. Total RNA was extracted from two human ES cell lines (H7 and H9), two BM-MSC lines (commercially available from Lonza and PromoCell) and two AFS cell lines isolated in house (A1 and H1). The quantity and purity of the extracted RNA was evaluated using a NanoDrop ND-1000 spectrophotometer (Nanodrop Technologies, Wilmington, DE) and its integrity measured using an Agilent Bioanalyzer. For microarray hybridizations, 1.5 ug of amplified cDNA from each sample was labeled with Arrayit 540 dye (Arrayit; Sunnyvale, CA) using the Arrayit Aminoallyl cDNA Labeling kit (Arrayit; Sunnyvale, CA) following the manufacturer’s protocol. The amount and quality of the fluorescently labeled cRNA was assessed using a NanoDrop (ND-1000) spectrophotometer and an Agilent Bioanalyzer. Following manufacturer’s specifications, 2.0 ug of 540-labeled cRNA was hybridized to Human H25K Whole-Genome Microarrays (Arrayit; Sunyvale, CA) for 3.5 hrs, prior to washing and scanning. Data were extracted from scanned images using Arrayit’s Feature Extraction Software . Background subtracted intensity data were generated for each transcript within each of the six samples. Following removal of transcripts for which the annotation was incomplete, there were ~16,000 data points for each sample. These were rank-ordered based on intensity, (from 1 to 65,000) and transcripts displaying an intensity of 200 or greater (background + 2SD) were used for further analysis. All genes displaying an intensity value of >200 were then evaluated in a Venn diagram to display genes that were: (a) expressed in all three cell types, (b) expressed exclusively in a single cell type or (c) expressed in two of the cell types but not the third. Conclusions The gene expression data generated in this study suggest that: (1) gene expression between individual MSC cell lines is more variable than gene expression in either AFS or ES cell lines and, (2) AFS cells share more common transcript expression with ES cells than do MSCs. A Venn diagram generated from a comparison of ~7000 of the most highly expressed genes from each cell type (ES vs. AFS vs. MSC) showed that 65% of the transcripts are expressed in all three. AFS cells and MSCs shared an additional 890 expressed transcripts, bringing their transcriptional similarity up to approximately 78%. Future Directions RNA and DNA derived from the six cells lines assayed in this pilot study will be used to take the characterization further. Through microRNA and epigenetic (promoter methylation) profiling we should better able to describe molecular features that define functional aspects of each of these three cell types. The original hypothesis that AFS cells are more similar to ES cells than are MSCs was supported by these data. AFS and ES cells share an additional 648 common transcripts whereas MSCs and ES cells only share an additional 70 transcripts. Wake Forest Institute for REGENERATIVE MEDICINE