Download
1 / 1
10 likes | 116 Views
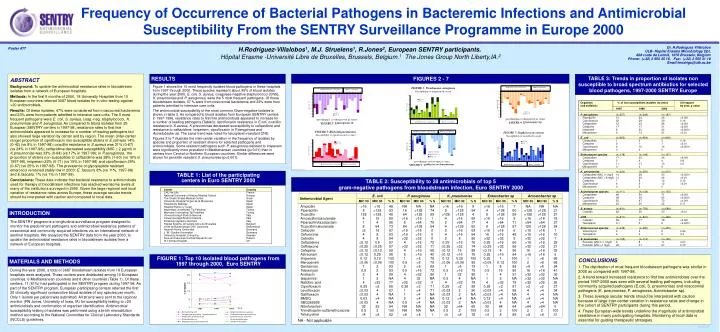
Frequency of Occurrence of Bacterial Pathogens in Bacteremic Infections and Antimicrobial Susceptibility From the SENTRY Surveillance Programme in Europe 2000. Antimicrobial Agent. Ampicillin Piperacillin Ticarcillin Amoxicillin/clavulanate Piperacillin/tazobactam

E N D
Frequency of Occurrence of Bacterial Pathogens in Bacteremic Infections and Antimicrobial Susceptibility From the SENTRY Surveillance Programme in Europe 2000 Antimicrobial Agent Ampicillin Piperacillin Ticarcillin Amoxicillin/clavulanate Piperacillin/tazobactam Ticarcillin/clavulanate Cefazolin Cefuroxime Cefoxitin Ceftazidime Ceftriaxone Cefepime Aztreonam Imipenem Meropenem Gentamicin Tobramycin Amikacin Isepamicin Nalidixic acid Ciprofloxacin Levofloxacin Gatifloxacin BMSQ SBQ265805 Nitrofurantoin Trimethoprim-sulfamethoxazole Tetracycline >16 8 128 4 1 8 2 4 4 0.12 0.25 0.12 0.12 0.12 0.06 1 0,5 2 1 4 0.25 0.03 0.03 0.03 0.03 32 0.5 4 >16 >128 >128 16 4 64 16 8 8 0.5 0.25 0.12 0.25 0.12 0.06 2 2 4 2 >32 >2 4 4 >4 4 32 2 >8 48 53 48 80 96 73 87 93 94 97 97 99 96 100 100 93 93 99 NA 77 86 87 NA NA NA 94 100 62 NA 16 64 >16 8 64 >16 >16 >32 4 >32 4 8 1 0.5 2 0.5 4 4 >32 0.25 1 1 2 0.5 NA NA >8 NA >128 >128 >16 >64 >128 >16 >16 >32 >16 >32 >16 >16 >8 >8 >8 >16 >32 32 >32 >2 >4 >4 >4 >4 NA NA >8 NA 74 59 1 79 64 0 0 0 72 11 68 40 78 79 69 72 80 NA 0 71 71 NA NA NA NA NA 1 >16 8 >128 4 2 4 2 4 2 0.25 0.25 0.12 0.12 0.12 0.06 1 0.5 1 0.5 4 0.25 0.03 0.03 0.12 0.03 32 0.5 4 >16 >128 >128 >16 >64 >128 >16 >16 8 >16 >32 16 >16 0.25 0.06 >8 >16 32 4 >32 >2 2 2 >4 2 >64 2 >8 5 54 4 68 77 62 63 64 90 76 74 88 75 100 99 73 70 88 NA 79 88 90 NA NA NA 65 100 78 >16 4 8 >16 4 8 >16 16 >32 0.25 0.25 0.12 0.25 0.25 0.06 1 0.5 1 1 4 0.25 0.03 0.03 0.12 0.03 32 0.5 4 >16 >128 >128 >16 >64 >128 >16 >16 >32 >16 >32 4 >16 1 0.12 8 16 4 2 >32 >2 >4 >4 >4 4 64 2 8 7 60 55 5 71 57 6 48 5 66 68 96 64 100 100 88 80 91 NA 78 87 88 NA NA NA 64 100 85 NA >128 >128 >16 >64 128 >16 >16 >32 >16 >32 16 >16 1 2 >8 16 >32 >32 >32 >2 4 4 >4 4 >64 2 >8 NA >128 >128 >16 >64 >128 >16 >16 >32 >16 >32 >16 >16 >8 >8 >8 >16 >32 >32 >32 >2 >4 >4 >4 >4 >64 2 >8 NA 21 21 18 27 24 1 10 7 29 21 35 6 69 68 24 41 39 NA 26 27 34 NA NA NA 0 100 31 E. coli Acinetobacter sp P. aeruginosa Enterobacter sp K. pneumoniae MIC 50 MIC 50 MIC 50 MIC 50 MIC 50 MIC 90 MIC 90 MIC 90 MIC 90 MIC 90 % S % S % S % S % S TABLE 2: Susceptibility to 28 antimicrobials of top 5 gram-negative pathogens from bloodstream infection, Euro SENTRY 2000 Center CHU de Lille National University of Athens Medical School The Chaim Sheba Medical Center University Hospital Virgen de la Macarena Hospital de Bellvitge Hospital Ramon y Cajal Hacettepe Universitesi Tip Fakultesi Marmara Universitesi Tip Fakultesi Universita degli Studi di Genova Universita degli Studi di Catania Policlinico Agostino Germelli Hopital Erasme-Université Libre de Bruxelles Unité de Bacteriologie CHU Lausanne Heinrich-Heine Universitat J.-W.-Goethe Universitat University Hospital, Linkoping Sera and Vaccines Central Research Lab St Thomas Hospital Country France Greece Israel Spain Spain Spain Turkey Turkey Italy Italy Italy Belgium SwitzerlandGermany Germany Sweden Poland UK NA - Not applicable H.Rodriguez-Villalobos1, M.J. Struelens1, R.Jones2, European SENTRY participants.Hôpital Erasme -Université Libre de Bruxelles, Brussels, Belgium.1 The Jones Group North Liberty,IA.2 Dr. H.Rodriguez Villalobos ULB- Hopital Erasme Microbiology Dpt, 808 route de Lennik, 1070 Brussels, Belgium Phone: (+32) 2 555 45 18, Fax: (+32) 2 555 31 10 Email:hrodrigu@ulb.ac.be Poster #77 ABSTRACT Background: To update the antimicrobial resistance rates in bloodstream isolates from a network of European hospitals. Methods: In the first 9 months of 2000, 18 University Hospitals from 10 European countries referred 3087 blood isolates for in vitro testing against >20 antimicrobials. Results: Of these isolates, 47% were considered from nosocomial bacteremia and 23% were from patients admitted to intensive care units. The 5 most frequent pathogens were E. coli, S. aureus, coag.-neg. staphylococci, K. pneumoniae and P. aeruginosa. As compared to blood isolates from 25 European SENTRY centers in 1997-98, resistance rates to first line antimicrobials appeared to increase for a number of leading pathogens but also showed large variation by center and by region. The mean (inter-center range) proportion of ciprofloxacin non-susceptible strains in E.coli was 14% (0-42) (vs 8% in 1997-98); oxacillin resistance in S.aureus was 31% (0-67) (vs 24% in 1997-98); ceftazidime decreased susceptibility (MIC 2 µg/ml) in K.pneumoniae was 33% (0-64) (vs 17% in 1997-98); in P.aeruginosa, the proportion of strains non-susceptible to ceftazidime was 28% (1-60) (vs 16% in 1997-98), imipenem 22% (0-71) (vs 15% in 1997-98) and ciprofloxacin 29% (0-67) (vs 25% in 1997-98). The prevalence of glycopeptide resistant enteroccci remained stably low in 2000: E. faecium, 8% (vs 11%, 1997-98) and E.faecalis, 1% (vs 1% in 1997-98). Conclusions: These data indicate that bacterial resistance to antimicrobials used for therapy of bloodstream infections has reached worrisome levels at many of the institutions surveyed in 2000. Given the large regional and local variation of resistance rates across Europe, these average secular trends should be interpreted with caution and compared to local data. RESULTS FIGURES 2 - 7 TABLE 3: Trends in proportion of isolates non susceptible to broad spectrum antibiotics for selected blood pathogens, 1997-2000 SENTRY Europe Figure 1 shows the 10 most frequently isolated blood pathogens in these hospitals from 1997 through 2000. These species represent about 85% of blood isolates during the year 2000. E. coli, S. aureus, coagulase negative staphylococci (CNS), K. pneumoniae and P. aeruginosa, were the 5 most frequent pathogens. Of these bloodstream isolates, 47 % were from nosocomial bacteremia and 23% were from patients admitted to intensive care units. The antimicrobial susceptibility of the most common Gram-negative isolates is shown in table 2. As compared to blood isolates from European SENTRY centers in 1997-1998, resistance rates to first line antimicrobials appeared to increase for a number of leading pathogens (Table3): ciprofloxacin resistance in E.coli, oxacillin resistance in S.aureus, K.pneumoniae decreased susceptibility to ceftazidime and resistance to ceftazidime, imipenem, ciprofloxacin in P.aeruginosa and Acinetobacter sp. The same trend was noted for teicoplanin-resistant CNS. Figures 2 to 7 illustrate the inter-center variation in the frequency of isolates by species and proportion of resistant strains for selected pathogens and antimicrobials. Some resistant pathogens such P. aeruginosa resistant to imipenem were significantly more prevalent in Mediterranean countries (p<0.01) than in centers from Central or Northern European countries. Similar differences were shown for penicillin resistant S. pneumoniae (p<0.001). Organism % of non susceptibles isolates by years Chi-square and antibiotic by year, p value 1997 1998 2000 P. aeruginosa (n=257) (n=248) (n=187) Piperacillin 13 23 26 <0,001 Ciprofloxacin 22 29 29 0.14 Ceftazidime 12 20 28 <0,001 Cefepime 17 17 31 <0,001 Imipenem 8 20 22 <0,0001 Meropenem 9 14 21 <0,01 E. coli (n=963) (n=954) (n=649) Ceftazidime 1 2 3 0.18 Cefepime 0 1 1 <0,01 Ciprofloxacin 6 10 14 <0,0001 Meropenem 0 0 0 _ Enterobacter species (n=178) (n=199) (n=137) Ceftazidime 17 35 34 <0,001 Cefepime 3 4 4 0.8 Ciprofloxacin 11 17 13 0.2 Meropenem 0 0 0 _ K. pneumoniae (n=204) (n=250) (n=213) Ceftazidime (MIC >1 mg/l) 14 28 33 <0,0001 Ceftazidime (MIC > 8 mg/l) 13 26 24 <0,01 Cefepime 7 8 12 0.12 Ciprofloxacin 4 6 12 <0,01 Meropenem 0 0 0 _ Acinetobacter species (n=111) (n=138) (n=100) Ceftazidime 46 50 71 <0,001 Cefepime 38 36 65 <0,0001 Ciprofloxacin 52 47 73 <0,001 Meropenem 24 20 32 0.11 S. aureus (n=931) (n=759) (n=589) Oxacillin 22 26 30 <0,01 CNS (n=811) (n=841) (n=428) Oxacillin 69 77 78 <0,001 Teicoplanin 0.1 3 6 <0,0001 Enterococcus species (n=338) (n=280) (n=232) Vancomycin 4 4 6 0.46 Teicoplanin 4 4 2 0.4 S. peumoniae (n=105) (n=112) (n=105) Penicillin (MIC 0.1-1mg/l) 4 8 11 0.07 Penicillin (MIC >1 mg/l) 28 31 27 0.73 TABLE 1: List of the participating centers in Euro SENTRY 2000 INTRODUCTION The SENTRY program is a longitudinal surveillance program designed to monitor the predominant pathogens and antimicrobial resistance patterns of nosocomial and community acquired infections via an international network of sentinel hospitals. We analyzed the SENTRY data from the year 2000, to update the antimicrobial resistance rates in bloodstream isolates from a network of European hospitals. FIGURE 1: Top 10 isolated blood pathogens from 1997 through 2000, Euro SENTRY CONCLUSIONS 1. The distribution of most frequent bloodstream pathogens was similar in 2000 as compared with 1997-98. 2. A trend toward increased resistance to first line antimicrobials over the period 1997-2000 was seen with several leading pathogens, including community acquired pathogens (E.coli, S. pneumoniae) and nosocomial pathogens (K. pneumoniae, P. aeruginosa, Acinetobacter sp). 3. These average secular trends should be interpreted with caution because of large inter-center variation in resistance rates and change in the cohort of SENTRY participants during this period. 4. These European-wide trends underline the magnitude of antimicrobial resistance in many participating hospitals. Monitoring of local data is essential for guiding therapeutic strategies. MATERIALS AND METHODS During the year 2000, a total of 3087 bloodstream isolates from 18 European hospitals were analyzed. These centers were distributed among 10 European countries: 6 Mediterranean countries and 6 other countries (Table 1). Of these centers, 11 (61%) had participated in the SENTRY program during 1997-98. As part of the SENTRY program, European participating centers referred the first 20 clinically significant consecutive blood isolates of any species per month. Only 1 isolate per patient was submitted. All strains were sent to the regional monitor (RN Jones, University of Iowa, IA) for susceptibility testing to >20 antimicrobials and confirmation of organism identification. Antimicrobial susceptibility testing of isolates was performed using a broth microdilution method according to the National Committee for Clinical Laboratory Standards (NCCLS) guidelines. A156-25