Download
1 / 27
270 likes | 432 Views
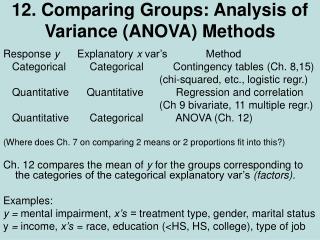
Module 7: Comparing Datasets and Comparing a Dataset with a Standard. How different is enough?. Concepts. Independence of each data point Test statistics Central Limit Theorem Standard error of the mean Confidence interval for a mean Significance levels How to apply in Excel.

E N D
Module 7: Comparing Datasets and Comparing a Dataset with a Standard How different is enough?
Concepts • Independence of each data point • Test statistics • Central Limit Theorem • Standard error of the mean • Confidence interval for a mean • Significance levels • How to apply in Excel module 7
Independent Measurements • Each measurement must be independent (shake up basket of tickets) • Example of non-independent measurements • Public responses to questions (one result affects next person’s answer) • Samplers too close together, so air flows affected module 7
Test Statistics • Some number calculated based on data • In student’s t test, for example, t • If t is >= 1.96 and • population normally distributed, • you’re to right of curve, • where 95% of data is in inner portion, symmetrically between right and left (t=1.96 on right, -1.96 on left) module 7
Test statistics correspond to significance levels • “P” stands for percentile • Pth percentile is where p of data falls below, and 1-p fall above module 7
Two Major Types of Questions • Comparing mean against a standard • Does air quality here meet NAAQS? • Comparing two datasets • Is air quality different in 2006 than 2005? • Better? • Worse? module 7
Comparing Mean to a Standard • Did air quality meet CARB annual standard of 12 microg/m3? module 7
Central Limit Theorem (magic!) • Even if underlying population is not normally distributed • If we repeatedly take datasets • These different datasets have means that cluster around true mean • Distribution of these means is normally distributed! module 7
Magic Concept #2: Standard Error of the Mean • Represents uncertainty around mean • As sample size N gets bigger, error gets smaller! • The bigger the N, the more tightly you can estimate mean • LIKE standard deviation for a population, but this is for YOUR sample module 7
For a “large” sample (N > 60), or when very close to a normal distribution… Confidence interval for population mean is: Choice of z determines 90%, 95%, etc. module 7
For a “Small” Sample Replace Z value with a t value to get… …where “t” comes from Student’s t distribution, and depends on sample size module 7
Compare t and Z Values module 7
What happens as sample gets larger? module 7
What happens to CI as sample gets larger? For large samples Z and t values become almost identical, so CIs are almost identical module 7
First, graph and review data • Use box plot add-in • Evaluate spread • Evaluate how far apart mean and median are • (assume sampling design and QC are good) module 7
Excel Summary Stats module 7
Use the box-plot add-in • Calculate summary stats N=77 module 7
Our Question • Can we be 95%, 90%, or how confident that this mean of 14.78 is really greater than standard of 12? • We saw that N = 77, and mean and median not too different • Use z (normal) rather than t module 7
The mean is 14.8 +- what? • We know equation for CI is • Width of confidence interval represents how sure we want to be that this CI includes true mean • Now, decide how confident we want to be module 7
CI Calculation • For 95%, z = 1.96 (often rounded to 2) • Stnd error (sigma/N) = (8.66/square root of 77) = 0.98 • CI around mean = 2 x 0.98 • We can be 95% sure that mean is included in (mean +- 2), or 14.8-2 at low end, to 14.8 + 2 at high end • This does NOT include 12 ! module 7
Excel can also calculate a confidence interval around the mean Mean, plus and minus 1.93, is a 95% confidence interval that does NOT include 12! module 7
We know we are more than 95% confident, but how confident can we be that Ft Smith mean > 12? • Calculate where on curve our mean of 14.8 is, in terms of z (normal) score… • …or if N small, use t score module 7
To find where we are on the curve, calc the test statistic… • Ft Smith mean = 14.8, sigma =8.66, N =77 • Calculate test statistic, in this case the z factor (we decided we can use the z rather than the t distribution) • If N was < 60, test stat is t, but calculated the same way Data’s mean module 7 Standard of 12
Calculate z Easily • Our mean 14.8 minus standard of 12 (treat real mean m (mu) as standard) is numerator (= 2.8) • Standard error is sigma/square root of N = 0.98 (same as for CI) • so z = (2.8)/0.98 = z = 2.84 • So where is this z on the curve? • Remember, at z = 3 we are to the right of ~ 99% module 7
Where on the curve? Z = 2 Z = 3 So between 95 and 99% probable that the true mean will not include 12 module 7
You can calculate exactly where on the curve, using Excel • Use Normsdist function, with z If z (or t) = 2.84, in Excel Yields 99.8% probability that the true mean does NOT include 12 module 7