Download
1 / 1
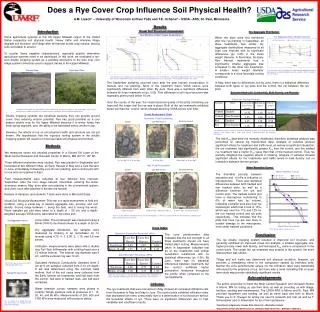
10 likes | 116 Views
Does a Rye Cover Crop Influence Soil Physical Health?. A.M. Liesch + – University of Wisconsin at River Falls and T.E. Ochsner*– USDA –ARS, St. Paul, Minnesota. Results. Introduction. Visual Soil Structural Assessment. Dry Aggregate Distribution. Two Months of Soil Visual Assessment.

E N D
Does a Rye Cover Crop Influence Soil Physical Health? A.M. Liesch+ – University of Wisconsin at River Falls and T.E. Ochsner*– USDA –ARS, St. Paul, Minnesota Results Introduction Visual Soil Structural Assessment Dry Aggregate Distribution Two Months of Soil Visual Assessment Some agricultural systems in the US Upper Midwest region of the United States jeopardize soil physical health. Heavy traffic and intensive tillage degrade soil structure, and tillage after fall harvest buries crop residue, leaving soils vulnerable to erosion. To counter these negative characteristics, regionally specific alternative agricultural systems need to be developed. In this work, we evaluated a rye-corn double cropping system as a possible alternative to the sole crop corn silage system commonly used to support dairies in the Upper Midwest. Dry Aggregate Mean Weight Diameter When the plots were first monitored after the rye planting in September, all three treatments had similar dry aggregate distributions measured at all eight size intervals with no significant differences (p< 0.05) in the mean weight diameter. In November, the Early Rye Harvest treatments had a significantly smaller aggregate size compared to the other two treatments. A smaller mean weight diameter corresponds to a more favorable rooting conditions. Control Plots Rye Cover Plots Over the course of the sampling, the mean weight aggregate diameter decreased or remained steadily low in the rye plots, and increased in the control plots. Over the course of sampling, the visual structure really improves in the rye treatments, especially at depths below 10 cm. All of the plots were similar in September, but by June, there were statistical differences in all treatments. The standard error bars are shown. The September sampling occurred soon after the post harvest incorporation of manure and rye planting. None of the treatment mean VSSA scores were significantly different from each other. By June, there was a significant difference between all three treatments at (p< 0.05). This difference in soil visual structure was especially pronounced below 10 cm. Over the course of the year, the visual structural quality of the plots containing rye improved the longer that the rye was in place. Both of the rye treatments exhibited better soil than the control, which showed declining VSSA scores over time. In May, there was no differences, but by June, there is a statistical difference between both types of rye plots and the control, but not between the rye plots. Saturated Hydraulic Conductivity, Bulk Density, and Porosity Select Soil Physical Features The difference between the groundcover at the control and rye plots are obvious. The control plots have a lot of exposed soil, as opposed to the ryes covered surface, making the soil vulnerable to wind erosion. Visual Assessment Table Double cropping systems are beneficial because they can provide ground cover, thus reducing erosion potential. Rye has good potential as a cool season double crop for the Upper Midwest because it is winter hardy, has early spring regrowth, and the ability to be harvested before another crop. However, the effects of rye on soil physical health and structure are not yet known. We hypothesize that the vigorous rooting system in the double cropping system will result in a more favorable soil physical environment. November Visual Assessment Early Rye Harvest Control Late Rye Harvest The treatments with rye present showed a remediating effect on trafficking and higher porosity, Ksat values, and a lower bulk density, indicating better soil physical parameters. The raw Ksat data were not normally distributed; therefore, statistical analysis was performed on natural log transformed data. Analysis of variance showed significant effects for treatment and traffic level, as well as a significant interaction. the rye treatment had significantly greater Ksat than the control, and the tracked rye treatment had a higher Ksat value than that of the tracked control. Thus rye partially mitigated the negative effects of tracking. Analysis of variance showed significant effects for the treatments and traffic levels in bulk density, but no interaction between the two groups. Methods We measured seven soil physical properties in a Doland Silt Loam at the West Central Research and Outreach Center in Morris, MN (45° N , 95° W). Three different treatments were studied: Rye was planted in September and harvested at two different times, an Early Harvest in May and a Late Harvest in June, immediately followed by a no-till corn planting; and a control plot with no rye and corn planted in April. Field measurements were collected at four different time intervals: September, after the corn silage harvest; November, entering the winter dormancy season; May, soon after corn planting in the conventional system; and June, soon after planting of the late rye harvest. 0-5 cm Sq 2.5, 5-25 cm Sq 4 0-25 cm Sq 2 0-6cm Sq1, 6-25 cm Sq 2 May Visual Assessment Water Retention Curves Early Rye Harvest Control Late Rye Harvest Water Retention Curves The drainable porosity between saturation and -10 kPa is indicative of macroporosity. There was statistical differences between both tracked and non tracked plots, as well as a difference between the rye and control plots. The tracked control plot have a macropores contributing to 6% of water loss by volume, indicating a smaller pore size than rye tracked plot which had a loss of 10%, which was near the 11% and 12% for the non tracked control and rye plots respectively. This indicates that the plots that have rye are less likely to sustain damage to the macropores, even under tracked conditions. Analysis of Variance and students T tests were done in Microsoft Excel. Visual Soil Structural Assessment- This test is a rapid assessment of field soil condition, using a visual key to assess aggregate size, porosity, and root density. Scores range between 1, being the best, and 5, being the worst. Three samples per plot were taken to a depth of ~ 25 cm, and a depth-weighted average VSSA score calculated for the entire plot. 0-25 cm Sq 3.5 0-20 cm Sq 1, 20-25 cm Sq 1.5 0-18 cm Sq 1, 18-25 cm Sq 1.5 There is a clear difference between the rye and the control plots, as well as an improvement from the November sampling to the May sampling in the rye treatments. Cone Index- The soil strength was measured using a Rimik CP40 Cone Penetrometer to a depth of 30 cm. Dry aggregate distribution- dry samples were measured by shaking in an autoshaker for 10 minutes using 4.75, 4, 3, 2.36, 2, 1.18, and 0.5 mm sieves. Infiltration- measurements were taken with a double ring Turf-Tech Infiltrometer with a falling head over a 15 minute interval. The internal ring diameter was 6 cm, and the external ring was 10 cm. Saturated Hydraulic Conductivity- Samples were 5 cm by 5 cm samples collected from 5-10 cm depth. K sat was determined using the constant head method. Half of the soil cores were collected from the Early harvest rye treatments, and half were from the control, half were in tracked rows, and half were untracked. Water retention curves- samples were placed in ceramic Tempe pressure cells at pressures of 1, 10, 20, 40, and 80 kPa. Measurements of 200, 500 and 1500 kPa were measured with pressure plates. Dry Aggregate Sieves Cone Index These are our water retention curves September Penetration Resistance (MPa) The cone penetrometer data indicated that the soil strength in all three treatments should not have limited plant rooting. Measurements taken in September indicated that all of the treatments had similar penetration resistances with no statistical differences (p< 0.05). By June, there was no statistical differences between treatments but the control exhibited higher penetration resistance throughout the profile when compared to the rye treatments. Conclusion The rye double cropping system resulted in improved soil structure, and generally exhibited an improved visual soil analysis, a smaller aggregate size, higher porosity, lower bulk density, and increased Ksat value in comparison to the control plots. The longer the rye treatment was present in the system, the more improvement was shown. Tillage and soil traffic can deteriorate soil physical condition; however, rye provides a remediating effect to the compaction caused by trafficked soils. Neither the cone penetrometer values nor the infiltration rates were statistically influenced by the presence of rye, but there was a trend indicating that a longer term study may provide statistically significant results. May Penetration Resistance (MPa) This is the stack of sieves we used to separate aggregate sizes. Tempe Pressure Cells Note the improvement in the penetration resistance from September to May, especially at depths below the 10 cm interval in the rye treatments. Acknowledgements The author would like to thank the West Central Research and Outreach Station in Morris, MN for letting us use their land, as well as providing us with tillage, fertilizer, seeding and maintenance. The USDA-ARS in Morris and St. Paul, MN provided equipment and funding, as well as travel back and forth to Morris. Thank you to E. Krueger for letting me use his research plot trial, as well as T. Schumacher and G. Amundson for all of their assistance. Infiltration The rye treatments that were harvested in May showed an increased infiltration rate from November to May and May to June. The control plots exhibited infiltration rates that decreased over time, presumably due to a deterioration of soil structure without the beneficial effects of rye. There were no significant differences due to high variability and insufficient results. This is a photo of a Tempe Pressure Cell, which forces air through the soil, and creates drainage. +Department of Agronomy, Kansas State University – Manhattan, Kansas *Department of Plant and Earth Sciences, Oklahoma State University – Stillwater, Oklahoma


