Download
1 / 32
320 likes | 328 Views
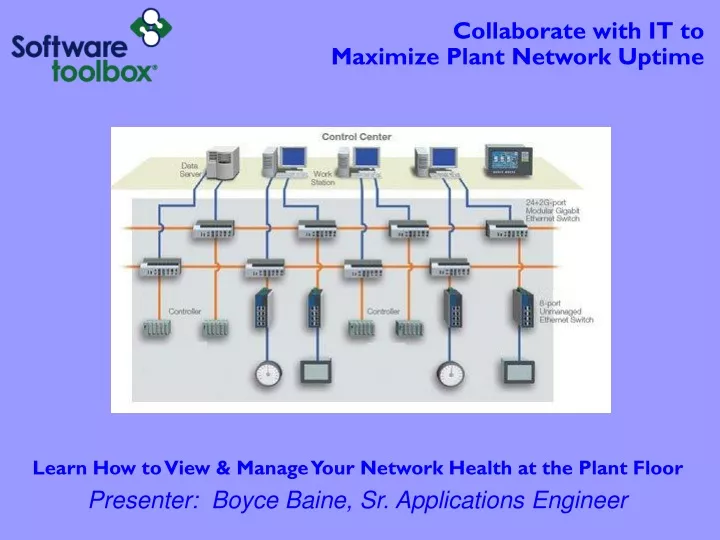
Collaborate with IT to Maximize Plant Network Uptime. Learn How to View & Manage Your Network Health at the Plant Floor Presenter: Boyce Baine, Sr. Applications Engineer. Agenda. Overview of Solutions Monitoring local PCs Monitoring Network Device Status Viewing Your Entire Network

E N D
Collaborate with IT to Maximize Plant Network Uptime Learn How to View & Manage Your Network Health at the Plant Floor Presenter: Boyce Baine, Sr. Applications Engineer
Agenda • Overview of Solutions • Monitoring local PCs • Monitoring Network Device Status • Viewing Your Entire Network • Tie It All Together • Q & A
TOP Server Gets You Connected! • http://www.toolboxopc.com/html/drivers_list.asp
TOP Server System Monitor OPC, Suitelink, DDE TOP Server OPC & I/O Server System Monitor Driver
Network Analyst – Available TagsInbound Bandwidth % Utilization
Network Analyst – Available TagsOutbound Bandwidth % Utilization
Network Analyst – Available TagsPort Health Status Indicator buPctIn.port < 20% 20% < buPctIn.port < 40% buPctIn.port > 40% buStat.port = 0 buStat.Port = 1 buStat.port = 2
Network Analyst – Available TagsSwitch Health Status Indicator
Tying It All Together HMI/SCADA Station Custom App. MES System System Monitor System Monitor TOP Server TOP Server Web Browser Historian (PI,Wonderware, GE Historian, etc.)
Tips & Tricks • Loads of free help at: http://www.toolboxopc.com/html/support.asp • Quick Start Guide • Training Videos • Papers and Utilities – Trouble Shooting Guide • More information on the Product Details tab • http://www.toolboxopc.com/html/product_details.html • Contact Software Toolbox support@softwaretoolbox.com while you are in the planning stage, so we can help
Contact Information & Other Learning Opportunities • Questions later? • Boyce Baine • bbaine@softwaretoolbox.com • 888-665-3678 or 704-849-2773 • support@softwaretoolbox.com • www.toolboxopc.com • www.softwaretoolbox.com • Other learning opportunities • Visit www.softwaretoolbox.com/webinars