Download
1 / 25
250 likes | 268 Views
Critique and evaluate a research article, focusing on the study's purpose, design, data analysis, and conclusions. Due date: Feb. 8. Worth up to 3 points.

E N D
today’s line-up • Homework #1 (due on Mon) • Debrief SPSS lab, variables and basic stats • View sample project from previous class • Homework #2 out • Database overview report – due Wed Feb 17 • Database overview: Academic Search Premier wed feb 3, 2016
Homework #1: Analyzing a research article • Select one of the seven research articles linked Jan 25 • Using the Analyzing Research Articles handout (also listed under Jan 25, need one?), critique the article • Focus on the purpose of the study, description of study design (participants, methods, how they collected data), data analysis and conclusions • Don’t worry about specific statistical analysis methods • Provide your own critique • Do the authors justify the importance of the study? • Do the authors really “answer” their research questions? • Is the research transparent – could you replicate the study? • Does the research design seem logical – is this the best way to address the research questions? • Due Mon, Feb 8– print or email to me by class time • Format – whatever works for you (bullets, address some but not necessarily all questions/points from handout) • Worth up to 3 points (out of 100)
Rationale for assignment • Use evaluative strategies and vocabulary to examine a scholarly research product • (the “analyzing information” part of our class title) • Explore research that has been conducted using the same dataset that we will be using for our project, the General Social Survey
SPSS Lab debrief • Able to access SPSS via UNC Virtual Lab? • https://virtuallab.unc.edu • Are you comfortable opening up the GSS dataset in SPSS? • Navigate through different variables • Look at descriptive statistics for one variable across cases SPSS Cheat Sheet
variables • variable – a characteristic that can vary in value among subjects in a sample or a population. We are interested in similarities and differences - variance • types of variables • categorical • quantitative
categorical variable • scale for measurement is a set of categories • examples: • Racial-ethnic group (white, black, Hispanic) • Political party identification (Dem., Repub., Indep.) • Vegetarian? (yes, no) • Mental health evaluation (well, mild symptom formation, moderate symptom formation, impaired) • Happiness (very happy, pretty happy, not too happy) • Religious affiliation • Major
SPANKING: Categorical (Single) Do you strongly agree, agree, disagree, or strongly disagree that it is sometimes necessary to discipline a child with a good, hard spanking? Categories: Code as: {strongly_agree} Strongly agree 5 {agree} Agree 4 {disagree} Disagree 3 {strongly_disagree} Strongly disagree 2 {dontknow} DON'T KNOW 1 {refused} REFUSED 0 Sample question from GSS
scales of measurement for categorical variables, two types: • nominal scale– unordered categories • preference for president, race, gender, religious affiliation, major opinion items (favor vs. oppose, yes vs. no) • ordinal scale– ordered categories • political ideology (very liberal, liberal, moderate, conservative, very conservative) • anxiety, stress, self esteem (high, medium, low) • mental impairment (none, mild, moderate, severe) • government spending on environment (up, same, down)
nominal scale – unordered categories PRES12: Categorical (Single) Did you vote for Obama or Romney? Categories: Code as: Obama 5 Romney 4 Other Candidate (Specify) 3 Didn’t vote for president 2 Don’t know 1 Refused 0
ordinal scale – ordered categories POLVIEWS: Categorical (Single) We hear a lot of talk these days about liberals and conservatives. I'm going to show you a seven-point scale on which the political views that people might hold are arranged from extremely liberal--point 1—to extremely conservative--point 7. Where would you place yourself on this scale? Categories: Code as: Extremely liberal 7 Liberal 6 Slightly liberal 5 Moderate, middle of the road 4 Slightly conservative 3 Conservative 2 Extremely conservative 1 DON'T KNOW 0 REFUSED 8
quantitative variable • possible values differ in magnitude • examples: • Age, height • Annual income • Time spent on online each week • Reaction time to a stimulus • (e.g., cell phone while driving in experiment) • Number of “life events” in past year
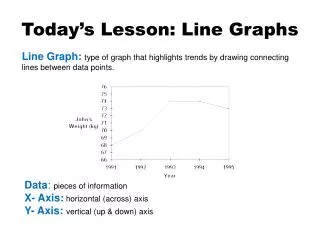
use of statistics to describe, summarize, and explain or make sense of a given set of data
Comparison of mean and median • Mean • Uses all of the data • Has desirable statistical properties • Affected by extreme high or low values (outliers – example*) • May not best characterize skewed distributions • Median • Not affected by outliers • May better characterize skewed distributions *UNC Geography Majors Salaries Example
mid-1980's at the University of North Carolina, the average starting salary of geography students was well over $100,000
Correlation Causation
sample patterns from GSS data • median income of female respondents compared with average income of male respondents • median level of education of respondents who own a gun • number of female respondents who own a gun compared with number of male respondents who own a gun • average age of respondents who indicated the government should spend more on space exploration • self-reported level of happiness compared with income level Example starting points for Data-to-Story Project
sample characteristics of the GSS • The sampling frame of the General Social Survey is all U.S. adults living in households. The sampling frame includes 97.3 % of all U.S. adults. • Who does not live in a household? • college students in dorms • military personnel in barracks • prisoners • elderly persons in retirement homes
Does the GSS sample really draw from all the adults in its sample frame? • After the GSS is sampled, only 70% of persons in the sample actually respond to the survey • 23% refuse or cut the survey off in the middle • 2% are unavailable or can’t be found • 5% are missing for other reasons • In general, a response rate of 60% or more is considered minimally acceptable, but you should check your results in any way you can.
You can look at actual GSS questionnaires http://www3.norc.org/gss+website/
where can you access SPSS? • Odum Institute • Davis Library 2nd floor – ask lab assistant • https://virtuallab.unc.edu • Lab in the Undergraduate Library (need to confirm)
Homework #2: Database Overview Report [handout]
Let’s look at a database of magazine & journal articles… …Academic Search Premier >> UNC Libraries Homepage: http://www.lib.unc.edu/ >> E-Research by Discipline >> Frequently Used >> Academic Search Premier [off-campus log in with onyen/password] [2 handouts]