Download
1 / 36
390 likes | 512 Views
Sea Level Change. Geography 1050. Trout River. Outline. Patterns and processes of sea-level rise in Atlantic Canada Glaciation, deglaciation, and isostatic rebound Types of evidence used to determine rates of sea-level rise Longterm Geomorphological & sendimentological evidence

E N D
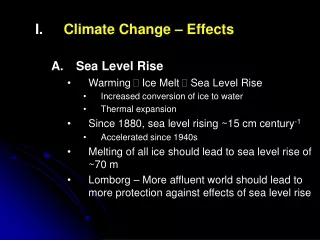
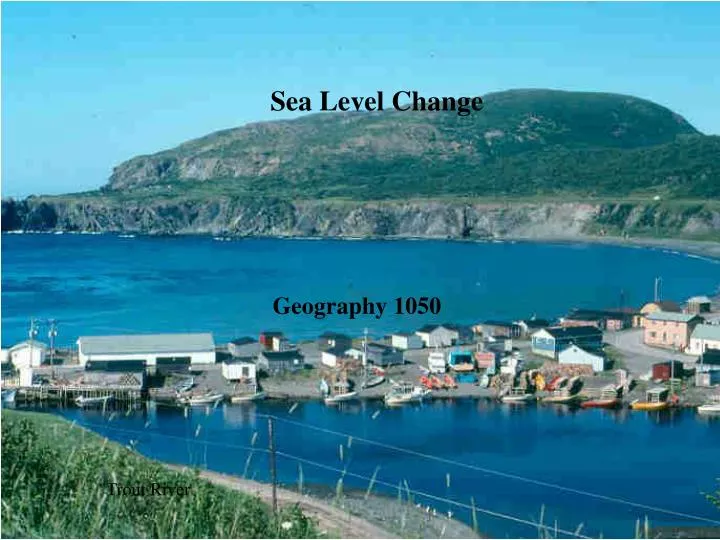
Sea Level Change Geography 1050 Trout River
Outline • Patterns and processes of sea-level rise in Atlantic Canada • Glaciation, deglaciation, and isostatic rebound • Types of evidence used to determine rates of sea-level rise • Longterm • Geomorphological & sendimentological evidence • C14 dating • Medium term • Short term • Adaptations to sea-level rise in Atlantic Canada
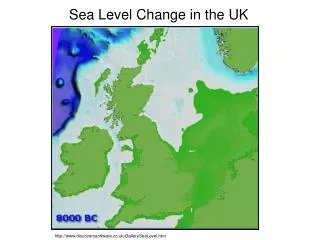
Sea Level Change • driven by local, regional, hemispheric, & global factors • Changes in sea level are not uniform • Each area is affected differently • “Global” sea level is only a theoretical concept
Atlantic Canada • Effects of glacial activity • melting of ice, adding more water to ocean • glacio-isostatic rebound: recovery of land as ice weight is removed
NL Glaciation • island covered by local ice caps • Labrador covered by large Laurentide glacier • Maximum thickness 2000 m • Weight of ice causes glacio-isostatic depression
Glaciation www.bio.umass.edu/biology/conn.river/iceages.html
Glaciation & deglaciation www.homepage.montana.edu/.../GLACIER%20LAB.htm
Deglaciation • Melting began 15,000 years ago • Complete between 9,000 and 7,000 years ago • Sea flooded into isostatically-depressed areas • 135 m a.s.l. at Gull Island Rapids, Labrador • 170 m at St. Anthony • 58 m at Laurenceton, Bay of Exploits (photo) • 35 m at Terra Nova National Park
Glacio-isostatic Rebound • Removal of weight of ice allows land to rebound • Sea forced to recede, relative sea level drops • Land ‘springs’ back, then subsides • Still happening around Lake Melville (1 mm per year) • Currently, rising sea levels around island of Newfoundland
Outline • Patterns and processes of sea-level rise in Atlantic Canada • Glaciation, deglaciation, and isostatic rebound • Types of evidence used to determine rates of sea-level rise • Long term • Geomorphological & sendimentological evidence • C14 dating • Medium term • Short term • Adaptations to sea-level rise in Atlantic Canada
Marine Clay at Springdale indicates sea level was 75 m higher than today 12,000 years ago How would you find out if this were marine clay or not? What proxy data would you use?
Dropstone indicates iceberg rafting, in marine clay near Lower Churchill project site What makes this stone peculiar? What proxy data could you use to find out more?
youngest Sequence of “raised beaches” formed as sea level gradually withdrew, Coastal Labrador younger oldest
Sea Level 12,000 years ago Raised Beach, Sandy Cove, Eastport Peninsula What kinds of proxy data would tell us this?
Old Man sea stack, Trout River, NL
Outline • Patterns and processes of sea-level rise in Atlantic Canada • Glaciation, deglaciation, and isostatic rebound • Types of evidence used to determine rates of sea-level rise • Long term • Geomorphological & sendimentological evidence • C14 dating • Medium term • Short term • Adaptations to sea-level rise in Atlantic Canada
Sea-Level History in Atlantic Canada • Higher sea levels immediately following deglaciation; • Dropping to levels lower than present between 8,000 and 5,000 a ago (varying from place to place); • Currently rising (except for Lake Melville)
How do we know? • for long time scales (100s or 1000s of years): • Maps & bathymetric charts • Archaeological sites • 14C dating
14C dating • Radiometric decay of 14C • Organic deposits only • Not valid for deposits younger than 1950 • Used for deposits up to 30,000 years old • Dates expressed as “BP”
Broad Cove, Avondale Submerged black spruce stump
For a reliable date, the stump should be rooted in peat under the beach gravel (so it is not a piece of driftwood). This stump indicates sea level rise at about 2.5 – 3 mm per year over the past 1800 years Ship Cove, Placentia Bay
Outline • Patterns and processes of sea-level rise in Atlantic Canada • Glaciation, deglaciation, and isostatic rebound • Types of evidence used to determine rates of sea-level rise • Long term • Geomorphological & sendimentological evidence • C14 dating • Medium term • Short term • Adaptations to sea-level rise in Atlantic Canada
Medium (intermediate) Time Scales • Assessment over decades through human infrastructure (docks, moorings) and/or tide gauge records • Airphotos and satellite imagery indicate coastal erosion, beach retreat • Personal photographs Topsail Beach, ca. 1910
Mooring ring was installed above high tide position ca. 1750; today high tide rises above ring (approx to person’s helmet) Mooring Ring, Louisbourg, NS
Currently rising at 2 mm/a, the wall is necessary to prevent this Beothuk site from being washed away Eroding archaeological site, The Beaches, Bonavista Bay
Middle Cove Middle Cove
Outline • Patterns and processes of sea-level rise in Atlantic Canada • Glaciation, deglaciation, and isostatic rebound • Types of evidence used to determine rates of sea-level rise • Longterm • Geomorphological & sendimentological evidence • C14 dating • Medium term • Short term • Adaptations to sea-level rise in Atlantic Canada
Short Term • Humans cannot look at the sea from one year to the next and recognize rising levels visually • natural tidal changes in sea level • daily variations due to storms • Recognition of relative sea level rise based on long-term and intermediate-term analyses. • Tidal component must be accounted for (‘filtered out’) before sea level rise can be recognized.
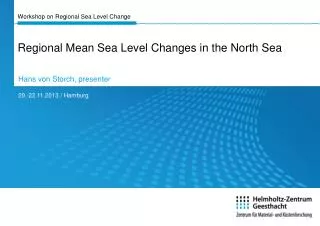
Elevations of tidal position over time (diamonds) at Cuxhaven, Germany • although individual levels vary, the overall trend indicates rise 1788-1995
Sea Level change-net results • Observed rates of sea level change (from all causes combined) in Atlantic Canada vary from 1 mm per year to more than 5 mm per year • S. & E. Newfoundland – 3 to 5 mm per year • Fundy and SW Nova Scotia – 3 mm per year • Gulf of St. Lawrence coast – 2 to 3 mm per year • Labrador - +1 to – 1 mm per year
Outline • Patterns and processes of sea-level rise in Atlantic Canada • Glaciation, deglaciation, and isostatic rebound • Types of evidence used to determine rates of sea-level rise • Longterm • Geomorphological & sendimentological evidence • C14 dating • Medium term • Short term • Adaptations to sea-level rise in Atlantic Canada
If you live on the shore… • Sea level is rising, regardless of cause • If your property is eroding, the cause is less important than is taking action • Adaptation is required
Adaptation Strategies • Reinforce (armour) the coast • Retreat and rebuild • Rezone the coastal area Ferryland Bauline East
Conception Bay South Conception Bay South
Summary • Patterns and processes of sea-level rise in Atlantic Canada • Glaciation, deglaciation, and isostatic rebound • Types of evidence used to determine rates of sea-level rise • Longterm • Geomorphological & sendimentological evidence • C14 dating • Medium term • Short term • Adaptations to sea-level rise in Atlantic Canada