Download
1 / 30
300 likes | 445 Views
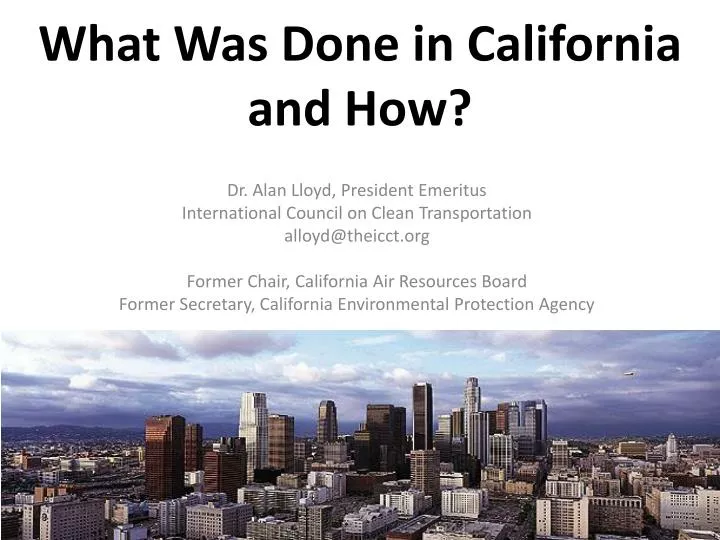
What Was Done in California and How?. Dr. Alan Lloyd, President Emeritus International Council on Clean Transportation alloyd@theicct.org Former Chair, California Air Resources Board Former Secretary, California Environmental Protection Agency . We regulate emissions. Authorities

E N D
What Was Done in California and How? Dr. Alan Lloyd, President Emeritus International Council on Clean Transportation alloyd@theicct.org Former Chair, California Air Resources Board Former Secretary, California Environmental Protection Agency
We regulate emissions Authorities Motor vehicles and fuels (under federal Clean Air Act exemption) Air toxics, consumer products, greenhouse gases (under California law) Oversight over Local Responsibilities Stationary and area sources Transportation planning targets Rulemaking Process Public hearing of Governing Board Public workshops and stakeholder meetings Public and legislative support
Our national impact Federal Clean Air Act Exemption for California vehicle emission standards To meet “compelling and extraordinary” conditions Must meet or exceed federal regulations Can be adopted by other states (15 including Northeast States, Oregon, Washington) California Firsts Lead-free gasoline Low-sulfur fuels Three-way catalytic converter Stringent NOX control
Our policy instruments Performance-based Emission Standards Aftertreatment effective but turnover slow Retrofits and repowering also beneficial Fuel improvements provide immediate benefits Incentive Funding $150M per year for diesel engines $1B for port trucks and equipment Market-based Programs Carbon emission trading for large sources Enforcement and Monitoring Programs
Science informs our policies Legislative Requirements Automotive Engineer and M.D. on Governing Board Health-based ambient air quality standards Extramural research program with external oversight Peer review of scientific basis for regulations Workforce 70% engineers and scientists In-house research Field/Modeling Studies Los Angeles and San Joaquin Valley Air Basins
California’s air pollution problem Unique geography and meteorology confine air pollutants Over 90% of Californians breathe unhealthy air 38 M people 90 people per km2 24 M gasoline cars 1.3 M diesel vehicles 1.4 B km per day 18 M off-road engines 3 large container ports
Air quality after World War II Unhealthy levels of lead, NO2, SO2, CO, ozone, particulate matter, and air toxics Poor visibility Difficulty breathing Extreme eye irritation In Los Angeles Over 100 smog alerts annually Over 300 days with unhealthy air annually
Cancer risks from airborne toxics*(90% of risk from traffic pollutants) Diesel PM 1,3-Butadiene Hexavalent Chromium Carbon Tetrachloride para-Dichlorobenzene Benzene Perchloroethylene Formaldehyde Acetaldehyde All Others * Estimated 400 cases/year in 2005 (dioxins not included).
Air pollution causes premature deathCalifornia estimates *2009-2011 for PM2.5; 2005 for ozone and TAC Note: 233,00 total deaths in 2010
Our current targets Air Quality By 2020, attain annual PM2.5 of 12 µg/m3 By 2023, attain 8-hour ozone of 80 ppb By 2025, attain 24-hour PM2.5 of 35 µg/m3 By 2032, attain 8-hour ozone of 75 ppb Diesel and Freight Transport By 2020, diesel PM risk 85% below 2000 levels Greenhouse Gases By 2020, reduce to 1990 levels (AB 32) By 2050, 80% below 1990 levels
Major California control programs • Smoke controls began in 1945 • Backyard burning, open burning at garbage dumps, industrial smoke • Hydrocarbon controls begin in 1956 • Gasoline storage tanks and trucks • 1970s • Industrial SOX controls • Lead and RVP limits for gasoline • Three-way catalysts for passenger cars • 1980s • On-board diagnostics • Low-sulfur gasoline and diesel • 1990s • Air toxics • 2000s and beyond • Light trucks meet same standards as cars • Diesel PM and NOX • Greenhouse gases
Performance-based regulations Mobile Sources (>99% gasoline, 98% diesel reduction) Cleaner engines Aftertreatment Cleaner gasoline and diesel fuel Alternative fuels Stationary Sources (80-90% reduction) Low-NOX burners Selective catalytic reduction Cleaner fuels Area Sources (>75% reduction) Vapor recovery Low-volatility solvents, paints, consumer products
Light-duty emission standards EGR TWC On-Board Computer NOx Advanced Computer Fuel Injection O2 Sensor Oxidation Catalyst HC 1966 Unleaded Gasoline 1993 1975
Heavy-duty emissions standards Computer Control EGR DPF SCR
California Progress on Black Carbon Ramanathan et al. (2013)Black Carbon and the Regional Climate of California, CARB Contract No. 08-323 22
Air pollution reduced 75-90% despite growth Carbon Monoxide Nitrogen Dioxide Sulfur Dioxide Population Number of Vehicles Vehicle Miles Ozone – Los Angeles peak reduced 70%, hours of exposure by 90% PM10 – annual-average levels reduced 75% Air toxics – lead eliminated, cancer risk reduced 80% (since 1989) Black carbon – reduced 90% (95% by 2020)
Costs of Control 0.5% GDP (US 1990-2020) Benefits of Control $10-95 in health benefits for each $1 of control (US 1970-1990) $30 in health benefits for each $1 of control (US 1990-2020)* Air pollution control industry – 32,000 jobs and $6.2B (CA 2001) Clean energy industry – 123,000 jobs and $27B (CA 2009) U.S. EPA Reports to Congress on The Benefits and Costs of the Clean Air Act (www.epa.gov/air/sect812/index.html) * 1990-2020 uncertainty analysis under development
Climate Pollutant Emissions(2010) Global California 26
California leader in energy efficiency 14,000 United States California 12,000 New York 10,000 8,000 kWh/person 6,000 4,000 2,000 0 1960 1965 1970 1975 1980 1985 1990 1995 2000 year 27 www.eia.doe.gov/emeu/states/sep_use/total/csv/use_csv
Major California GHG policies • Transportation • 54.5 mpg fleet average by 2025 • 1.5 million zero emission vehicles by 2025 • 10% lower carbon intensity by 2020 • ~7.6% per capita VMT reduction by 2020, ~12% by 2035 (SB 375) • Electricity generation • 33% renewable by 2020 • No coal after 2025 (SB 1368) • 12,000 MW renewable self generation by 2025 • Energy efficiency • Appliance standards • $2.5B for school retrofits (Prop 39), retrofit existing building (AB 758) • Zero energy new residential buildings by 2020, commercial by 2030 • Water • 20% per capita water consumption reduction by 2020 • Waste • 75% diversion by 2020 (AB 341)
Summary • California had worst air quality in world • Current air pollution health risk • PM2.5 >> ozone > air toxics • Emissions control focus • 1950s and 1960s: smoke • 1970s and 1980s: lead, SOX, hydrocarbons and NOX • 1990s to present: diesel PM and NOX, air toxics, GHG • Air quality improved 75-90% over past 45 years • Benefits much greater than control costs • Need to achieve 80-90% GHG control