Download
1 / 15
180 likes | 362 Views
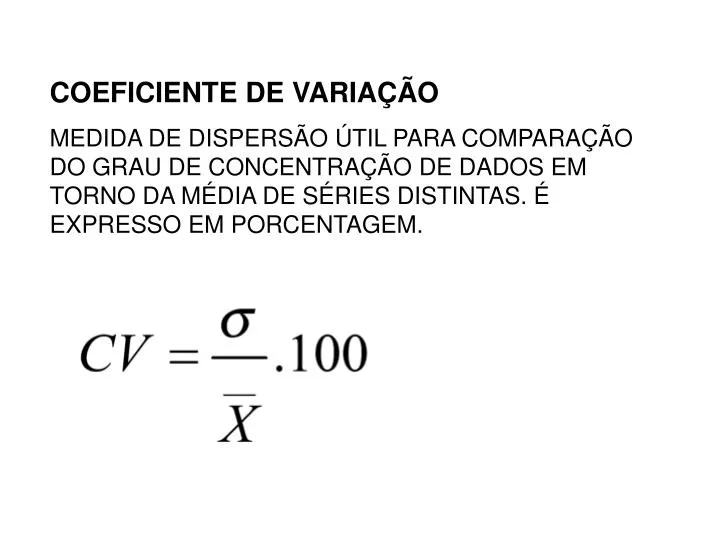
COEFICIENTE DE VARIAÇÃO MEDIDA DE DISPERSÃO ÚTIL PARA COMPARAÇÃO DO GRAU DE CONCENTRAÇÃO DE DADOS EM TORNO DA MÉDIA DE SÉRIES DISTINTAS. É EXPRESSO EM PORCENTAGEM. Exemplo:

E N D
COEFICIENTE DE VARIAÇÃO MEDIDA DE DISPERSÃO ÚTIL PARA COMPARAÇÃO DO GRAU DE CONCENTRAÇÃO DE DADOS EM TORNO DA MÉDIA DE SÉRIES DISTINTAS. É EXPRESSO EM PORCENTAGEM.
Exemplo: Numa empresa, o salário médio dos homens é de 4000,00 com σ= 1500,00, e o das mulheres é em média de 3000,00, com σ= 1200,00. Qual o grupo com maior dispersão salarial?
Coeficiente de Pearson Coeficiente de Bowley
Exemplos • Classifique, quanto a assimetria, a distribuição abaixo, segundo o coeficiente de Pearson. Mo =2 Coeficiente de Pearson É uma distribuição assimétrica positiva fraca
2) Classifique, quanto a assimetria a distribuição abaixo segundo o coeficiente de Bowley. Q1=4,29 Q3=6,97 Md=5,75 Coeficiente de Bowley É uma distribuição assimétrica negativa
Atividade: Usando as medidas de posição: • Usando o coeficiente de BowleyClassifique, quanto a simetria, a distribuição • abaixo. • 2) Classifique, quanto a curtose, a distribuição abaixo.
1) Considere o seguinte conjunto de dados: 40, 52, 55, 60,70,75,85,90,90,92,94,94,95,98,100,115,125,125. Faça o Box plots da distribuição. 2) Traçar o box plot e identificar a presença de outliers nos dados a seguir: 5,3 8,2 13,8 74,1 85,3 88,0 90,2 91,5 92,4 92,9 93,6, 94,3 94,8 94,9 95,5 95,9 96,6 97,7 98,1 99,0 101,4 103,7 106,0 113,5