Download
1 / 30
300 likes | 403 Views
Supporting visual queries. O n medium-sized n ode-link diagrams. Colin Ware Robert bobrow. 이 준 우. Agenda. 0. Abstract. 1 . Introduction. 2. Experiment 1. A. Condition. B . Result From Experiment 1. C. Discussion From Experiment 1. 3 . Experiment 2. A . Condition.

E N D
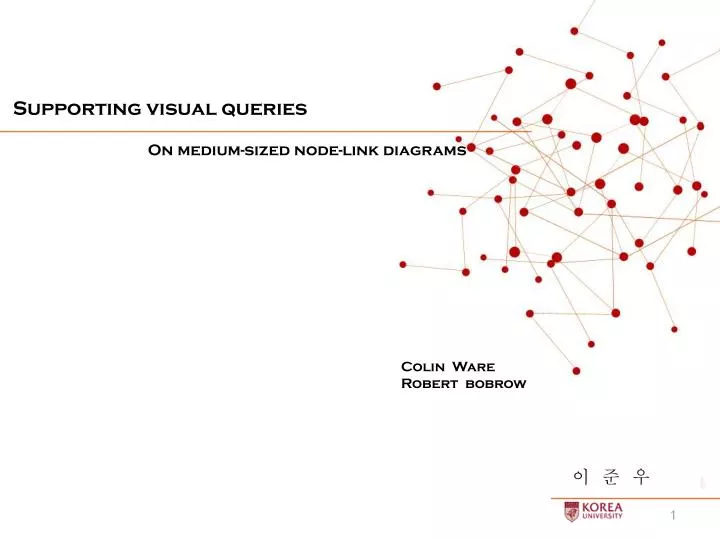
Supporting visual queries On medium-sized node-link diagrams Colin Ware Robert bobrow 이 준 우
Agenda 0. Abstract 1. Introduction 2. Experiment 1 A. Condition B. Result From Experiment 1 C. Discussion From Experiment 1 3. Experiment 2 A. Condition B. Result From Experiment 1 C. Discussion From Experiment 1 4. Conclusion
Abstract Abstract 3 3
Abstract For reason of clarity, typical node-link diagram statically displayed on paper or computer screen contains fewer than 30 nodes Abstract However, Many problems would benefit if far more complex information could be diagrammed so, Suggest, a subset of a larger diagram is highlighted by using set into motion when a node is selected with mouse Two Experimental evaluation 1. With 4 highlighting techniques : static, motion, static+motion, none 2. Distinction, showing two subsets of a larger network 4
Introduction Introduction 5 5
Introduction : Graph Example Introduction Graph representing all of the employee`s e-mail traffic in large company The problem is this many nodes and links between them cannot be legibly in static diagram 6
Introduction : Interactive technique Introduction The problem of obtaining information from a visual display such as a graph - cognitively constructing - executing a series of visual queries Interactive technique for improving the graphical design Visual search can be supported by means of interactive technique as in Constellation of MEGraph(Motion enhanced graph) MEGraph : clicking on a node causes a breath-first search and set a subset that specified topological radius is highlighted by being set into motion 7 7
Introduction : Oscillatory motion Introduction Previously, in an empirical evaluation of MEGraph, Giving a subgraphan oscillatory motion should be very effective way of highlighting information A pre-attentive visual cue Supports conjunction search (coupling of visual cues) Motion enhancement is more effective than static highlighting However, There are two criticisms 1. Graph have quite small nodes 2. And did not take the time of interaction The goal of 2nd experiment Two subgraphs of larger graph 8 8 8
Experiment 1 Experiment 1 9 9
Experiment 1 Experiment 1 Effectiveness of motion highlighting with medium-sized graphs Goal : to find the relative values of motion highlighting and static highlighting on graphs with various size of nodes Highlighting : breadth-first search around a selected node and visually searching for red nodes 10
Task Experiment 1 Task In the highlighting condition the subject had to move the mouse over the node 2. Click on it Visually search the highlighted subset to find out if there was a red node Pressed one of two keys on the keyboard the ‘M’ key for yes and ‘N’ key for no 11 11
Conditions and trial blocks Experiment 1 Conditions No highlighting Static highlighting Motion highlighting Static and motion highlighting combined Trial blocks 4 graph size : 32, 100, 320,1000, 3200 nodes So, graph size gave 20 conditions Experiment was run as a within-subject design Subjects The 13 subjects were mostly undergraduate students 13 13
Procedure Experiment 1 Subject were given a practice session in each condition New graph generate and make a series of six responses(3 with yes, 3 with no) Entire process was repeated three times This was repeated until they had seen all graph sizes under that highlighting method And given blocks of trials with each of the other highlighting condition 14 14 14
Results from experiment 1 Experiment 1 Result of error rate All of the interactive highlighting conditions resulted in much lower error rate Motion and static cue (2.7%) Static cue (3.9%) Motion cue (3.9%) No highlighting condition (34.7%) Target was present (13.6%) Target was absent (9.1%) 15 15 15 15
Results from experiment 1 Experiment 1 Result of error rate Three-way ANOVA factor Graph size Highlighting method Target present vs target absent Highlighting method : (F(3,4640)=366.0, p<0.0001) Graph size : (F(1,4640)=13.8, p<0.0001) Target present vs target absent : (F(1,4640)=2.29, p<0.0001) Tukey HSD test : Two groups No highlighting condition vs the others 16 16 16 16 16
Results from experiment 1 Experiment 1 Result of response time Little variation in response times for first four graph size Longest response time in 3200 nodes Time increase was less in the no highlighting condition High error rate also had faster responses Due to subject gave up early on the difficult condition 17 17 17 17 17 17
Discussion of experiment 1 Experiment 1 Main practical result is Make medium-sized diagrams accessible to queries about node In no highlighting smallest graph would be not usable in application Unexpected result The shorter response times for the no highlighting were not expected Failed to confirm Motion highlighting can be more effective So, Rather then replace static highlighting Motion highlighting can be an additional highlighting technique 18 18 18
Experiment 2 Experiment 2 19 19
Experiment 2 Experiment 2 Supporting visual queries with two highlighted subgraphs The problem of distinctly highlighting two subgraphsof a larger graph Because it require a visual conjunction search Hypothesis : having static highlighting on one subset and motion highlighting on the other would be most effective way 20
Conditions Experiment 2 Summary of conditions for experiment 2 All conditions had two subgraphs highlighted In half trials, the two subset had 2 or 3 nodes in common, in half they were disjoint Graphs always had 1000 nodes 21 21
Conditions : example Experiment 2 Horizontal motion (For subgraph B) Vertical burst motion (For subgraph A) 22 22 22
Task and Subjects Experiment 2 Task Large graph containing two highlighted subsets was presented on the subject If there were common nodes between two subsets (yes response) press right mouse key If there were no common nodes between two subsets (no response) press left mouse key Subjects The 12 subjects were a combination of graduate and undergraduate student 23 23
Procedure Experiment 2 Subject were given a practice session in all 8 condition And with overlap and without overlap Conditions were given in a different random order 20 trials presented in each condition In half the trials the two subgraphs had nodes in common; in half didn`t All of the conditions were given, take a rest for a few minute and repeated 2nd trial 24 24 24
Results from experiment 2 Experiment 2 Result of error rate Use of static highlighting for one subset and motion cues for the other resulted in dramatically reduced error rate (2.6% vs 22.5%) Much higher error rate with condition c7, there were far fewer yes responses than no responses 25 25 25 25
Results from experiment 2 Experiment 2 Result of response time All condition used static highlighting for one subset and motion cues for the other were in the group with the shortest response time (mean 1.16s) Response times were longer for condition where there were higher error rate Tukey HSD test (c1,c2,c3,c4) < c8 < (c5,c6,c7,c8) mean 1.16s 3.48s 4.15s 26 26 26 26 26
Discussion of experiment 2 Experiment 2 The results strongly support the idea that the conjunction of motion and non-motion cues Can be rapidly searched visually Failed to find pairs of motions that supported rapid visual searches Clearly perceive nodes that belong to both subset If one is highlighted using motion and the other is highlighted using static cues 27 27 27 27 27 27
Conclusion Conclusion 28
Conclusion Conclusion 29 29
Thank you 30