Download
1 / 35
350 likes | 483 Views
Statistical Postprocessing of LM Weather Parameters. Susanne Theis Andreas Hense. Ulrich Damrath Volker Renner. Overview. - Introduction - Short Description of Neighbourhood Method - Verification Results - Calibration - Concluding Remarks.

E N D
Statistical Postprocessing of LM Weather Parameters Susanne Theis Andreas Hense Ulrich Damrath Volker Renner
Overview - Introduction - Short Description of Neighbourhood Method - Verification Results - Calibration - Concluding Remarks
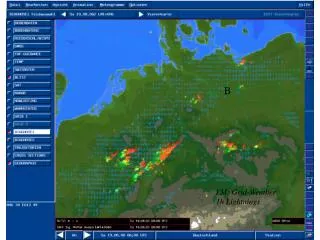
LM Total Precipitation [mm/h] 08.Sept.2001, 00 UTC, vv=14-15 h
Neighbourhood Method Assumption: LM-forecasts within a spatio-temporal neighbourhood are assumed to constitute a sample of the forecast at the central grid point
x x Definition of Neighbourhood I y t
Definition of Neighbourhood II Size of Area Form of Area hs Linear Regressions
Products • Probabilistic Information • Quantiles • (Exceedance probabilities for certain threshold values) • „Statistically smoothed” fields • Quantiles for p = 0.5 • Expectation Values
LM Total Precipitation [mm/h] 08.Sept.2001, 00 UTC, vv=14-15 h Original Forecast Expectation Values
LM Total Precipitation [mm/h] 08.Sept.2001, 00 UTC, vv=14-15 h Original Forecast Quantiles for p=0.9
LM T2m [oC] 08.Sept.2001, 00 UTC, vv=15 h Original Forecast Quantiles for p=0.5
Direct model output of the LM for precipitation at a given grid point
...supplemented by more quantiles (forecast of uncertainty)
...supplemented by the 90 %-quantile (forecast of risk)
Verification Data LM forecasts; 1.-15.09.2001; 00 UTC starting time 1 h values; 6-30 h forecast time all SYNOPs available from German stations comparison with nearest land grid point NM-Versions small: 3 time levels (3 h); radius: 3s ( 20 km) medium: 3 time levels (3 h); radius: 5s ( 35 km) large: 7/3 time levels (7/3 h); radius: 7s ( 50 km) Averaging square areas of different sizes temperatures adjusted with -0.65 K/(100 m)
Richardson, D.S., 2001: Measures of skill and value of ensemble prediction systems, their interrelationship and the effect of ensemble size. Q.J.R.Meteorol.Soc., Vol.127, pp. 2473-2489)
Calibration (addressing the effect of limited sample size only) Based on Richardson (2001) we derive a relation: p' = p' (p,M,m,s) M: effective sample size m,s: related to the parameters of the beta distribution (r,s)
Preliminary Result of Calibration Elimination of m and s Artificial choice: M=10 Reliability diagram of 1 h accumulated precipitation in the period 10.-24. July 2002 (LM forecasts starting at 00 UTC; small version of neighbourhood method)
original forecast small medium large [mm/h] Relative value of precipitation forecasts (original forecast and 90 % quantiles) for users, whose cost/lost ratio is equal to 10 % for the threshold values given by the abscissa
Concluding Remarks “Statistically Smoothed” Fields For temperature no mean advantage is to be seen in comparison with simple averaging The results for precipitation are difficult to judge upon; proper choice amongst the various possibilities is still an open question Reliability Diagrams Possible improvement by calibration remains to be explored The results for the lower quantiles of precipitation indicate the need for improving the model (reduce the overforecasting of slight precipitation amounts) Higher quantiles of precipitation seem to be valuable already without calibration
Concluding Remarks (ctd.) Outlook • Results of the neighbourhood method will be compared to those of more extensive experimental ensemble integrations • Calibration of quantiles will hopefully be further developed • The method will be tested on the 2.8 km LM version and compared to other/simpler methods. Application in combination with a small ensemble (LAF) will be investigated • The program has been implemented at MeteoSwiss and may be made available to other COSMO members