Download
1 / 30
680 likes | 2.81k Views
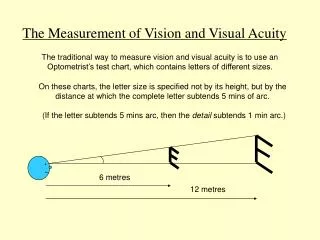
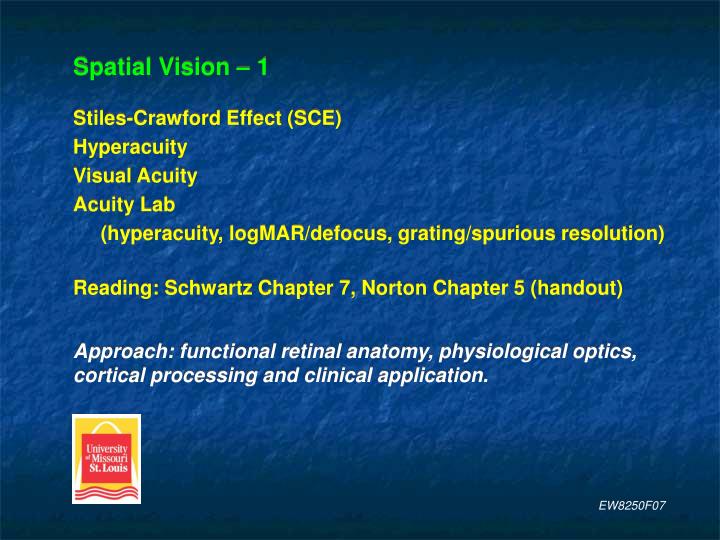
Spatial Vision – 1 Stiles-Crawford Effect (SCE) Hyperacuity Visual Acuity Acuity Lab (hyperacuity, logMAR/defocus, grating/spurious resolution) Reading: Schwartz Chapter 7, Norton Chapter 5 (handout)

E N D
Spatial Vision – 1 Stiles-Crawford Effect (SCE) Hyperacuity Visual Acuity Acuity Lab (hyperacuity, logMAR/defocus, grating/spurious resolution) Reading: Schwartz Chapter 7, Norton Chapter 5 (handout) Approach: functional retinal anatomy, physiological optics, cortical processing and clinical application. EW8250F07
Stiles-Crawford Effect (SCE-I, SCE-II) SCE of the First Kind (SCE-I, 1933) The brightness of a beam of light (ray) incident on a cone depends on its entry point in the pupil. Describes luminous efficiency. SCE of the Second Kind (SCE-II, 1937) The hue & saturation of a beam of light incident on a cone depends on its entry point in the pupil. Describes color effects. Example: when centrally fixating, monochromatic light presented at two locations in object space is perceived as having unequal hue and saturation. cone ray to pinhole Ref-4 EW8250F07
Study of SCE-I >> SCE-II.SCE-II typically not on NBEO.SCE-IA ray striking a cone perpendicularto its surface produces more bleachingof photopigment; psychophysically theperception of an increase in brightness. ray to pinhole cone Ref-4 EW8250F07
SCE-I The entry point resulting in a ray striking a cone perpendicular to its surface represents the SCE-I peak. The SCE-I peak typically does not correspond to the pupil center. Average empirical findings: ~ 0.4 mm nasal, ~ 0.2 mm superior Ref-5 EW8250F07
SCE-I peak typically does not correspond to the pupil center. Average empirical findings: ~ 0.4 mm nasal ~ 0.2 mm superior. Very similar to angle kappa (). Recall that your clinical measure is ‘angle ’ but you are actually measuring angle lambda (). Ref-5 Visual Optics Review Optical Axis: best fit line through centers of curvatures of optical surfaces. Pupillary axis = achromatic axis = chief ray: ray K ---> center E ---> retina. Visual axis = neural axis: fixation point ---> N ---> N’ ---> fovea. Line of sight: fixation point ---> E ---> E’ ---> fovea. Angle : pupillary axis to line of sight. Angle : pupillary axis to visual axis. Angle : optical axis to visual axis . EW8250F07
Full Effect Reduced Effect Minimal Effect (much loss from exit through wall) SCE-I is attributed to the waveguide properties of cones (analogy: the total internal reflection of fiber optics systems) and the similar dimensions of the cone outer segment and a quantum of light. Minimal in scotopic conditions, that is, luminous efficiency by rods do not require that rays strike perpendicular to their surface. Logical since the intent of scotopic vision is the capture of all light. Incident Ray Foveal Cone Inner-Outer Segment EW8250F07
Empirical studies find variable for function form and peak. SCE-I reduces the effective (actual) retinal illuminance or trolands; equivalent to having a smaller effective pupil size. Enhances retinal image quality by reducing the effects of light scatter, defocus and ocular aberrations. Overall acts as a variable density optical filter placed at the pupil: Bradley & Thibos EW8250F07
SCE-I is believed to reflect the overall alignment of the cones. This alignment shifts under conditions of natural, pathological or contact lens-induced displaced pupil. Thus the SCE-I represents a phototropic effect: foveal cones align themselves to the incident light. Ref-4 EW8250F07
SCE-I Methods Subjective methods: flicker photometry (reduce until not seen). Objective methods: fundus reflectometry, electroretinogram. Not measured clinically. Does not normally change with age. Clinically useful in understanding functional retinal plasticity. Bradley & Thibos Ref-4 EW8250F07
SCE-I Contemporary method: adaptive optics. Image cones (1 nasal to fovea) and reflected light; 7 pupil entries. Ref-6 Ref-6 EW8250F07
Cones located close to each other share similar pointing directions. Ref-6 Ref-6 1 mm displacement magnitude (pupil) EW8250F07
Not all cones are pointed nasal and superior to the pupil center. Central 2 mm pupil. Cones pointing direction. Pupillary axis. 95% CI for each cone direction. Ref-6 Ref-6 EW8250F07
Spatial Acuity: Definitions Generally the smallest spatial detail that can be detected, discriminated or identified. Detection Acuity: angular size of the smallest visible target; typically a dot or line target. Resolution Acuity: smallest spatial separation between two targets that can be discriminated. Localization Acuity: smallest spatial offset between targets that can be discriminated. Also called hyperacuity or vernier acuity. Identification Acuity: smallest detail of the letters or numbers that can be identified. Typically named for the optotype used for acuity, e.g. Snellen, logMAR, Sloane, HOTV. EW8250F07
Ref-1 Typical stimuli and thresholds (arc seconds) for normal subjects. Note: 30–40 arc seconds correlates to the width of a cone inner segment in the foveola of normal subjects. EW8250F07
Spot Target Example: Target: point source (like a star). Pupil size: 1.5, 2.4, 6.6 mm. Solid lines: retinal image spread. Dashed lines: pupil affect alone. Sharpest image: with 2.4 mm pupil. Star angular size 0.018” at the eye. Not visible in day due to light from the surrounding sky, despite its size increasing ≥ 200x due to the eye’s aberrations. Easily visible at night due to enhanced contrast. Note that target size (threshold) is often not equal to image size, especially for very small targets. diffraction limited image optimal image maximum aberration affect on image Detection acuity is the angular size of the smallest visible target. Threshold is limited more by the luminance or contrast of the retinal image of the target and less by its angular size (which is altered by the eye’s aberrations). Ref-1 EW8250F07
Detection acuity is limited more by the luminance or contrast of the retinal image of the target and less by its angular size. Line Target Example: Black line angular size 1” or 3” (thickness) at the eye. Visible due to the decrement in luminance from the surround, more than from increase in size (similar size (~2’) as the star) due to the eye’s aberrations. Note that target size (threshold) is often not equal to image size, especially for very small targets. Ref-1 EW8250F07
Ref-2 Optics. Point source image = Point Spread Function (PSF). Airy Disk (diffraction) pattern: a = angular radius = 1.22/d, where d = pupil diameter and = wavelength of light. Resolution acuity is the smallest separation between two targets that can be discriminated. It is limited by the quality target images (eye’s optics) and the sampling grain (retina). Ref-9 Sampling. Smallest separation = width of the the target PSF, i.e. first peak in first adjacent trough. Allows one cone per change in luminance. EW8250F07
Resolution acuity for lines is like that for points of light. Line Spread Function (LSF) for different pupil sizes: dashed lines = pupil effect alone. Ref-2 Ref-2 Optimal pupil size (least aberrations) is 2.4 mm. Keep in mind for clinical tests. EW8250F07
Resolution acuity for lines is like that for points of light. Aberration effect on a line and filament for different pupil sizes: Aberrations change with pupil size: large pupil ---> smaller pupil ---> smallest pupil Ref-2 Ref-2 Optimal pupil size (least aberrations) is 2.4 mm. Keep in mind for clinic tests. EW8250F07
(1” line, 3 mm pupil) Ref-2 Resolution Acuity.Line separation must enable one cone to detect the luminance decrement, i.e. hyperpolarize less than the adjacent cones. With optimal eye optics & cone spacing (avg 30”): Resolution acuity for two points or lines is 30–40” . Called the Minimum Angle of Resolution (MAR). Ref-1 EW8250F07
Ref-3 Resolution Acuity. Everyone cannot achieve a MAR of 30” – 40” due to differences in cone size, cone spacing and ocular aberrations. Ref-1 Ref-2 EW8250F07
Localization Acuity, or Hyperacuity, is the smallest spatial offset or difference in location between targets that can be distinguished. Examples: spatial-interval acuity and vernier acuity. Ref-1 Ref-4 Ref-3 Due to the LSF, targets that are close result in worse acuity. EW8250F07
Localization acuity develops late (age 9–11) – implicating visual cortex. Stereoacuity Localization (vernier) acuity starts late and reaches near adult levels late (age 9–11). Acuity Contrast Fusion OKN VEP Ref-7 EW8250F07
Estimates of retinal light distribution demonstrate the substantial difference difference between target separation and shift. Separation is analogous, regardless of spatial scale, to both resolution and identification acuity. How does the retina and visual system encode the shift information? Localization Acuity (Hyperacuity) Under optimal conditions, spatial offsets of 2–4” can be distinguished. This is much smaller than the 30” subtense of foveola cones. How does the visual system achieve this ‘hyperacuity’? Ref-2 EW8250F07
The Line Spread Function enables target shifts much smaller than the 30” subtense of foveola cones to influence adjacent cones. With LSF, x can be small to stimulate the adjacent cones. Without LSF, x must be large to stimulate the adjacent cones. Ref-3 Aberrations thus enable this fine discrimination ability. EW8250F07
The retinal mosaic generally matches the eye’s aberrations.For example, poor retinal sampling in the periphery is matched to the very aberrated peripheral retinal images.Localization acuity is just one example of how aberrations are beneficial, and could be viewed as designed, for optimal visual performance (perception and efficiency) in the central retina. Ref-3 EW8250F07
Lab used this example Triangles = reference line Circles = shift line (12”) Inset plots the absorption ratio: reference line / shift line Shows a 50% difference in absorption rate due to only a 12” shift. This information could signal the spatial offset. Many cones encode absorption rates for each line spread function; the difference across space is the likely mechanism for hyperacuity. Ref-2 EW8250F07
Localization acuity appears to involve specific retinal encoding and corresponding cortical processing. Evidence for the latter comes from developmental amblyopes (onset age 3–5) who show a disproportionate loss of vernier acuity relative to letter acuity. Vernier loss = cortical loss. Ref-2 Ref-7 EW8250F07
2 microns = foveola cone inner segment width We use 30” for a cone in the foveola. Nice LSF summary schematic to help visualize mechanisms for all acuities. Ref-9 EW8250F07
References Norton, T., Corliss, D., & Bailey, J. (2002). The psycholphysical measurement of visual function. Butterworth–Heinmann. Wandell, B. (1995). Foundations of vision. Sinauer. Regan, D. 2000). Human perception of objects: early visual processing of spatial form, defined by luminance, color, texture, motion, and binocular disparity. Sinauer. Schwartz, S. (2004). Visual perception: a clinical orientation. 3rd Ed. McGraw-Hill. Atchison, D., & Smith, G. (2000). Optics of the human eye. Butterworth–Heinmann. Roorda, A., & Williams, D. (2002). Optical fiber properties of individual human cones. Journal of Vision, 2, 404–412. Daw, N. (2006). Visual Development. Springer Science, NY. Moses, R. (Ed.) (1981). Adler’s physiology of the eye. 7th ed. Mosby. Michaels, D. (1980). Visual optics and refraction. 2nd. Ed. Mosby. Kaufman, P, & Alm, A. (Eds.). (2002). Adler’s physiology of the eye, 10th ed. Mosby. Chalupa, L, & Werner, J. (Eds). (2004). The visual neurosciences. Sinauer. EW8250F07