Download
1 / 34
350 likes | 475 Views
A viable energy strategy for reducing carbon emissions? . . . or “are we drinking the kool-aid?”. Biofuels and Carbon. Chad Kruger BIOAg Educator Ctr. For Sustaining Ag & Natural Resources UW Program on Climate Change Summer Inst. September 22, 2006.

E N D
A viable energy strategy for reducing carbon emissions? . . . or “are we drinking the kool-aid?” Biofuels and Carbon Chad Kruger BIOAg Educator Ctr. For Sustaining Ag & Natural Resources UW Program on Climate Change Summer Inst. September 22, 2006
Climate Friendly FarmingTM:Moving from Source to Sink Washington State University helping farmers develop and implement agricultural systems and practices that mitigate global climate change.
Carbon Sequestration: The bottom line . . . • Estimated storage potential of 10 to 40 Mg C per hectare state-wide (~15 – 63 tons CO2 equivalent fixed / acre) • Could take 50 - 100 years to increase the C content by 20 Mg / ha in Pullman (~32 tons CO2 equiv / acre – 4 years of a Ford Taurus). • Realistic annual potential • Washington Palouse ~ 0.4% of the state GHG emissions. • WA Dryland cropping area ~1% of the state GHG emissions. • Irrigated area? Depends on cropping system choices • Western Washington?????????????????? • May ultimately be a trade-off between managing for C storage and N2O reduction.
Which hurts more?$3 diesel or $.50 Nitrogen? *Calculated with $1.51 off-road diesel, $.37 / lb Nitrogen
Rapeseed Crambe Safflower Mustard Soybean Flax Sunflowers Home-Grown Energy: Oilseed Crops
Spokane Tri-Cities g ~45 ~55 ~63 ~70
PNW Oilseed production for biodiesel • Acreage requirements will be 2 – 4 X’s as high for dryland production. • Oilseed crop grown 1 out of 4 – 12 years on a given acre of land • Plant-back restrictions (sulfonyl urea herbicide): 40 of 42 LaCrosse area farmers have plant-back restrictions that require waiting 3 more years before they can plant canola
Major Crops of the Columbia Basin (OR, WA) Cost of Production $2,000 – 2,500 acre $110 – 160 acre Source OAS,WAS, 2002
Synergies: BioAg needs to drive Triple Bio Oilseeds help with weed / disease control, improve microbial communities in the soil, improve nitrogen and carbon cycling. $45 - $65 /acre savings on pesticide costs by planting mustard before potato
The cost of biodiesel As compared to Midwest crushing costs of ~$.20 / g In state RFS production = ~45% of distiller’s grains ~70% of canola meal Source: U of I Biodiesel Education Program: Cost Calculator
Home Grown Energy: Biomass Crops Blue-bunch wheat grass switchgrass Reed canary grass Hybrid poplar
Food vs. Fuel: A Red Herring? • Ethanol = 12% of US corn crop (1/3 of which is Distiller’s Grains) • Animal feed, artificial sweeteners, beverage alcohol = 67% of US corn crop USDA ERS 2005
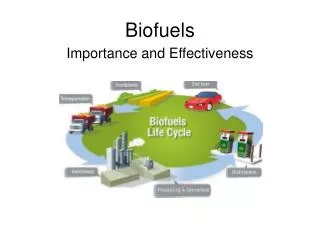
Biogas Collection Anaerobic Digester 1 2 3 4 5 Triple Bio in Action: Biomass Inventory Calculate Dry Values Identify Biomass Categories Inventory By County and Category Calculate Methane Potential Convert to electricity Eastern Washington 4.3 M tons/year 3.1 billion kWh 40% EW residential need Entire State 1769 MW capacity 50% of state residential need ~1.5 billion g ethanol > 12 million tons CO2 reduction
Dairy manure anaerobic digestion co-product research and development Nutrients CHP, LNG / CNG, Hydrogen, fertilizer, plastics textiles Fiber Carbon Credit & Green Tag
Treated fiber 2004 Digested Dairy Fiber Trial 3.3
Methane reduction: the bottom line . . . Electrical Production and Comparison with Gordondale • Methane destruction from Vander Haak Dairy = 9.47 tons/cow/year carbon dioxide equivalent
Nisin Production from Cheese Whey Cheese whey and/or whey permeate Nisin Fermentation Corn distillers solubles
Omega-3 Fatty Acids from Cull Potatoes Algal Fermentation Algae Feed High in Omega 3 Omega 3 Enriched Products
Co-Production of Lactic Acid and Chitosan from Cull Potatoes and Whey Permeate Whey Permeate
Glycerin Waste Biodiesel Production Algae Fermentation Healthy Dairy Products Dairy Feed Bioproducts and Biorefining Omega-3 Fatty Acids from Glycerin Waste
FeedstockPrice Cull Potato 1 ¢/lb Cheese Wheys 16-80 ¢/lb Cheese Wheys 16-80 ¢/lb Corn Distiller 1 ¢/lb Cull Potato or 1 ¢/lb Glycerol 5 ¢/lb Manure Neg-$50 cow/yr ProductUsePrice Lactic Acid Biopolymer 50 ¢/lb Chitosan Medical $4,500 /lb Lactic Acid Biopolymer 50 ¢/lb Nisin Preservative $3,400 /lb Algae Omega 3 Feed $5 /lb Electricity Energy $73 /cow yr Struvite Fertilizer $85 /cow yr HQ Fiber Soil Additive $70 /cow yr Value of Products Developed
Contact Information: Chad Kruger, BIOAg Educator WSU, CSANR 1100 N. Western Ave. Wenatchee, WA 98801 509-663-8181 x235 http://csanr.wsu.edu http://cff.wsu.edu cekruger@wsu.edu