Download
1 / 1
10 likes | 108 Views
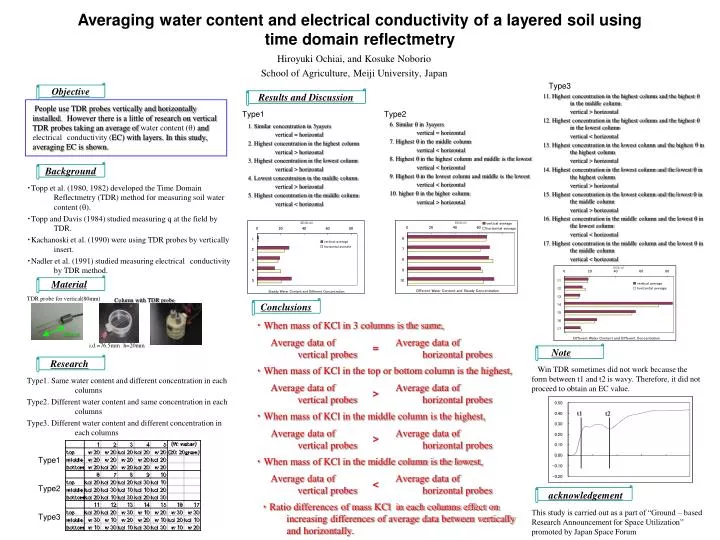
Averaging water content and electrical conductivity of a layered soil using time domain reflectmetry. Hiroyuki Ochiai, and Kosuke Noborio School of Agriculture, Meiji University, Japan. Type3. Objective. Results and Discussion.

E N D
Averaging water content and electrical conductivity of a layered soil using time domain reflectmetry Hiroyuki Ochiai, and Kosuke Noborio School of Agriculture, Meiji University, Japan Type3 Objective Results and Discussion 11. Highest concentration in the highest column and the highest q in the middle column vertical > horizontal 12. Highest concentration in the highest column and the highest q in the lowest column vertical < horizontal 13. Highest concentration in the lowest column and the highest q in the highest column vertical > horizontal People use TDR probes vertically and horizontally installed.However there is a little of research on vertical TDR probes taking an average of water content (q) and electricalconductivity (EC) with layers. In this study, averaging EC is shown. Type1 Type2 6. Similar q in 3yayers vertical = horizontal 7. Highest q in the middle column vertical < horizontal 8. Highest q in the highest column and middle is the lowest vertical < horizontal 9. Highest q in the lowest column and middle is the lowest vertical < horizontal 10. higher q in the higher column vertical > horizontal 1. Similar concentration in 3yayers vertical = horizontal 2. Highest concentration in the highest column vertical > horizontal 3. Highest concentration in the lowest column vertical > horizontal 4. Lowest concentration in the middle column vertical > horizontal 5. Highest concentration in the middle column vertical < horizontal Background 14. Highest concentration in the lowest column and the lowest q in the highest column vertical > horizontal 15. Highest concentration in the lowest column and the lowest q in the middle column vertical > horizontal 16. Highest concentration in the middle column and the lowest q in the lowest column vertical < horizontal 17. Highest concentration in the middle column and the lowest q in the middle column vertical < horizontal ・Topp et al. (1980, 1982) developed the Time Domain Reflectmetry (TDR) method for measuring soil water content (q). ・Topp and Davis (1984) studied measuring q at the field by TDR. ・Kachanoski et al. (1990) were using TDR probes by vertically insert. ・Nadler et al. (1991) studied measuring electricalconductivity by TDR method. Material TDR probe for vertical(80mm) Column with TDR probe Conclusions ・When mass of KCl in 3 columns is the same, 80mm Average data of vertical probes Average data of horizontal probes i.d.=76.5mm h=20mm = Note Research ・When mass of KCl in the top or bottom column is the highest, Win TDR sometimes did not work because the form between t1 and t2 is wavy. Therefore, it did not proceed to obtain an EC value. Type1. Same water content and different concentration in each columns Type2. Different water content and same concentration in each columns Type3. Different water content and different concentration in each columns Average data of vertical probes Average data of horizontal probes > ・When mass of KCl in the middle column is the highest, t1 t2 Average data of vertical probes Average data of horizontal probes > Type1 ・When mass of KCl in the middle column is the lowest, Average data of vertical probes Average data of horizontal probes < Type2 acknowledgement ・Ratio differences of mass KCl in each columns effect on increasing differences of average data between vertically and horizontally. This study is carried out as a part of “Ground – based Research Announcement for Space Utilization” promoted by Japan Space Forum Type3