Download
1 / 17
170 likes | 251 Views
Demographic Change and the National Parks of England. Dr. Nicola Thompson Lecturer Centre for Rural Economy, School of Agriculture, Food and Rural Development Newcastle University. Today. Basics on England and Wales National Parks

E N D
Demographic Change and the National Parks of England Dr. Nicola Thompson Lecturer Centre for Rural Economy, School of Agriculture, Food and Rural Development Newcastle University
Today • Basics on England and Wales National Parks • Why demography is important in shaping the present and future of the Parks • What the Office for National Statistics (ONS) 2011 census data tells us about key trends in the Parks • More questions than answers?
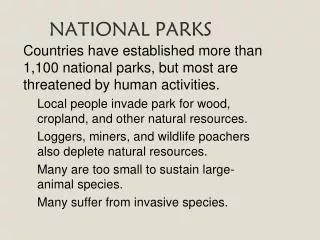
National Parks in England and Wales • 1949 National Parks and Access to the Countryside Act • 13 parks, 10.8% of land area, 0.7% of the population (402,900) purposes: • To conserve and enhance the natural beauty, wildlife and cultural heritage; and • To promote opportunities for the understanding and enjoyment of the special qualities by the public. National Park Authorities have an additional statutory duty • In pursuing the purposes, the Authority should seek to foster the economic and social well being of local communities within the National Park.
Demographic change? • ‘cultural landscapes’ concept • Debates around founding legislation demonstrate consensus around notion that communities should be maintained and supported. Dower and Hobhouse saw no conflict between farming and conservation • Managing authorities given few powers to intervene in social/economic matters. Resident populations seen as custodians.
Today - the language of park management plans • “working community” • “generations of human activity” • “relationship between working communities and the national park” “Thriving and vibrant communities are vital to the sustainability of the national park and a central theme of the National Park Management Plan” (Peak District NPA www)
World Heritage Site bid - Lake District • Cultural landscape category • http://www.lakedistrict.gov.uk/caringfor/projects/whs/why-the-lake-district
Critics of national parks point to… • Effect of designation on the economic sustainability of farming and other land management activities • Affordable housing – no homes for locals (or teachers, nurses, health and social care workers) • The preservation of a particular landscape aesthetic rather than evolving, living landscape
The role of communities…. But while debate continues on… • The impact of different land management activities • The appropriate policy response (especially relating to planning) • Whether the socio-economic duty should be a purpose There remains a high degree of consensus that national parks in England and Wales are living, working landscapes, not just breathing places!
Literature • Extensive on economic and social trends in farming communities. Often use NP case studies • More fragmentary on the rest of the NP population • Census data enables analysis of ‘national park trends’ but vitally the differences between them.
ONS characteristics of NPs, 2011 • NP population risen by 1.9% 2001 – 2011 (national increase 7.1%) • NPs have a much older age structure that rest of the population – one third aged over 60 • 1 in 8 household spaces has no usual resident • One in four economically active Park resident is self-employed (double national level) while unemployment is much lower
Important variations in population change • Very wide variations in population numbers and densities • 4 parks % decrease – Exmoor, Lakes and North York Moors. Tiny decrease in Peak District • Biggest gainers (6% +) South Downs and The Broads • Question – relation to wider demographic shifts or policy approaches?
ageing • Smaller proportions in all U45 age groups and greater proportion in all over 45 age groups than for England and Wales • Some variation in the pattern for 0 – 14 age group • All parks had a decrease in 30 - 44 age group between 2001 and 2011 and all had increases in the 60+ groups. • Median age 50, 11 years higher than national average
‘no usual resident’ • 14% of all household spaces had no usual resident compared with 4% nationally • Over 20% in Pembrokeshire, Lakes, Snowdonia and Yorkshire Dales • Less than 10% in Brecon Beacons, Dartmoor, New Forest and South Downs
employment • Working population defined by ONS in this case as those aged 16 – 74. increased from 665 in 2001 to 69% in 2011 • 19% self employed (compared to 10 % nationally) • Exmoor 39% of the economically active population self-employed • Only 5.4% of NP residents who are working are employed in agriculture (less than 1% nationally) • Much higher proportions in NPs classes as skilled trades and managers, directors and senior officials
More questions than answers? • Census provides some interesting statistical data that is specific to the national parks • Data should challenge those involved in NP management to decide what, or if, a response is necessary • Still a series of why questions that can’t be answered by census data alone • Need to understand the positive and negative implications of certain trends as have for ‘no usual resident’ for at least 30 years • Ageing • Self-employment
Conclusions • Socio-economic well being beyond affordable housing ? • Interactions between the noted trends and patterns clearly important • Implications for NP management planning? • Implications for public, private and voluntary sectors beyond the traditional conservation/recreation orientated agencies?