Download
1 / 23
230 likes | 433 Views
Trends in private investments and financing: A case study of Thailand’s energy sector. 28 Nov 2007 Chuenchom Sangarasri Greacen, Palang Thai Sairung Thongplon, Confederation of Consumer Organization, Thailand

E N D
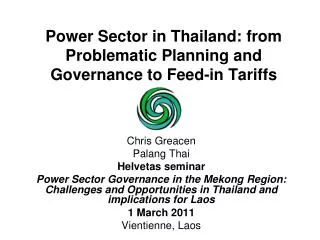
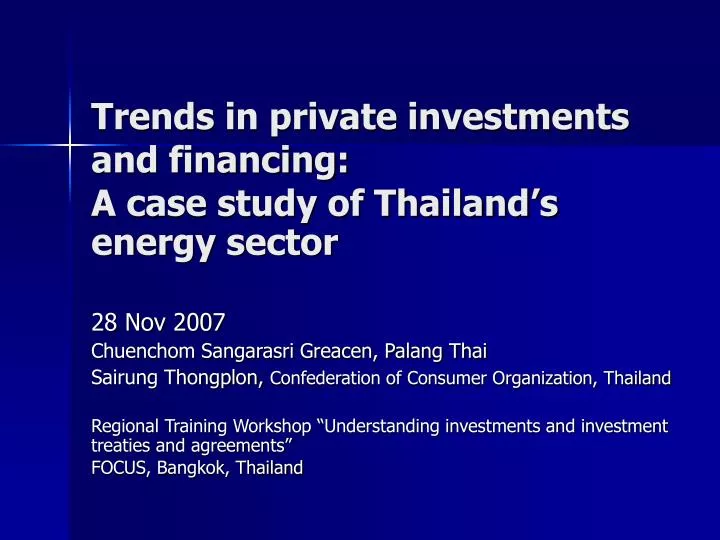
Trends in private investments and financing: A case study of Thailand’s energy sector 28 Nov 2007 Chuenchom Sangarasri Greacen, Palang Thai Sairung Thongplon, Confederation of Consumer Organization, Thailand Regional Training Workshop “Understanding investments and investment treaties and agreements” FOCUS, Bangkok, Thailand
Outline • Privatization trends • Investment trends • Financing trends • Implications for civil society advocacy
Privatization trends:the defeat of neo-liberal agendathe rise of nationalistic monopolistic “champions” • 60s-80s: development of state-led, centralized energy heavily influenced by USAID, WB • 90s: Neo-liberal reforms: partial privatization of SOE’s assets, IPPs, (failed) Power Pool or Third Party Access • 2000s: the rise of “National Champions”
The “National Champions”: the case of PTT, EGAT • PTT: privatized in 2001 • EGAT: IPO planned in 2006 but aborted and later reversed through a court verdict in a historic lawsuit brought on by consumer groups • PTT: facing a similar lawsuit, verdict expected next month
Monopoly with no Independent regulator Listing in the Stock market Partial public- private status Key features of PTT and (aborted) EGAT privatization To maximize “rent” (corruption revenue) by the ruling politicians in monopoly businesses through direct shareholding (nominee funds) and policy corruption
Privatization of monopoly utilities : aggression of money politics Make favorable policies Politicians- cum- businessmen Cabinet Parliament Regulators Listed companies w/ ties to politicians control Bureaucracy State-owned enterprises Nominees
A snapshot of PTT • Market cap 1 trillion baht ($30bn), 15% of Thailand’s stock market
MOF Others 52% 48% State privileges Monop. PTT Consum ers $ passthru Others 66% 34% State privileges PTTEP Modus Operandi to achieve “Aggressive growth” • PTT as mother company with monopoly rights and captive consumer base • PTTEP as partially private subsidiary with privileged access to state benefits, support and PTT’s financial strength • PTTEP pursues risky, high-return projects abroad Only 33% of PTTEP’s dividends returns to the state PTTEP alone accounts for 20% of PTT’s net income
PTT Net Profit (Million baht) 1999 2005 2006 = 95,261
Uneven attention by top-level energy bureaucrats: official duty vs. board meetings of energy company 100% 67% 90% 83% *2003 Annual Report of PTT Plc. **The subcommittee on automatic tariff adjustment mechanism (Ft charge), from Oct 2003-2004. Gas price charged by PTT was a main cost of the electricity tariff. Mr. Cherdpong and Metta served as the chairman and deputy chairman of the Ft subcommitee respectively. Government officials look after the private sector’s interests better than the public’s?
Trends in privatization:summary • Nationalistic • Monopolistic with regulator to counter-balance • Collusion of politicians-bureaucrats-businesses to maximize corruption rent, exploiting private-public identity
Trends in investment:Unnecessary investments“cooked up” by a consortium of “politicians-technocrats-businesses” to churn profits • Case in point: the 2007 Power Development Plan (PDP) calls for a doubling of capacity and ฿2trn investment in power sector alone • Clear gains in energy stocks as a result of business-friendly policy
Investment based on unrealistic demand forecast Increase in peak demand/year (MW) Mar-07 Forecast Actual Past averages: 20 yr = 897 MW 10 yr = 808 MW 14 yr avg = 1,884 MW 15 yr average = 914 MW Too high ? 1,000 MW/yr increase should be sufficient?
Supply options considered in PDP2007 • Only capital intensive, centralized gas/coal plants, large hydro, nuclear considered • DSM/CHP/RE not considered as options & very limited • DSM only 0.2% of saving • CHP SPP capped at 1,700 MW • RE/CHP VSPP capped at 1,100 MW L = low case B = base case H = high case 1=“lowest cost” 2=“probable coal scenario” 3=“LNG + increase power imports”
No need to build new green-field power plants in 15 years • Installed capacity as of May 2007 27,788 MW (Reserve margin = 22% ) • Planned capacity additions by 2021 (excluding all green-field coal-fired, nuclear, gas power plants, uncommitted hydro imports) = 14,876 MW • Substract decommissioned plants -8,462 MW • If allowing more CHP/cogen = 2,000 MW • If implementing additional DSM/EE measures = 1,500 MW • If allowing greater contribution from RE = 500 MW • Total generation capacity in 2021 = 38,202 MW • 2021 peak demand (if grows 1000 MW/yr) = 32,568 MW • Reserve margin* = 17% *Required minimum reserve margin of 15% to ensure system reliability
Secondary problemPrivate participation in investment • Half of the capacity additions -> private sector (IPP bidding & imports) • EGAT and its subsidiaries have similar conflict of interest issues as PTT’s • Competing IPP projects have cross shareholders
10% ปตท. กฟน. กฟผ. บ้านปู 66% 15% 33% 33% 50% 50% CLP 50% บริษัท ผลิตไฟฟ้า และน้ำเย็น 34% 25.41% Thai Oil Plc. ปตท.สพ. 22.4% 55% 26% 45% 15% 50% RATCH EGCO Thai Oil Power Gulf Electric 56% 15 -80% 25% 100% 50% 25% 100% 100% 100% ผลิตไฟฟ้าอิสระ (IPP) 700 MW ราชบุรี เพาเวอร์ (IPP) 1,400 MW ผลิตไฟฟ้าราชบุรี 3,645 MW ไตรเอนเนอยี (IPP) 700 MW น้ำเทิน 2 1,070 MW ระยอง 1,232 MW ขนอม 824 MW แก่งคอย Gulf (IPP) 1,468 MW BLCP (IPP) 1,400 MW SPPs 118 MW SPPs 789 MW SPPs 374 MW Cross-shareholding in energy business ตัวเลข % แสดงสัดส่วนการถือหุ้น
New IPPs ปตท. กฟน. 35% กฟผ. CLP Glow Energy บ้านปู 35% 30% 45% 14.99% 25.41% 22.42% 15% Gluf Electric Thai Oil Plc. RATCH EGCO 50% 50% 100% ราชบุรี อัลลัยแอนซ์ 50% Thai Oil Power 25% 100% 50% 100% 100% 100% 100% ผลิตไฟฟ้า อิสระ 700 MW ผลิตไฟฟ้า และน้ำเย็น ราชบุรี เพาเวอร์ 1,400 MW ผลิตไฟฟ้า ราชบุรี 3,645 MW ไตร เอนเนอยี 700 MW ระยอง 1,232 MW ขนอม 824 MW แก่งคอย 1,468 MW Glow IPP 713 MW BLCP 1,400 MW IPP (ชลบุรี) 735 MW IPP โรจนะ (อยุธยา) 1587 MW IPP (ราชบุรี) IPP (ราชบุรี) 1734 MW IPP (ระยอง) 1704 MW IPP นครศรีธรรมราช IPP (ระยอง) 1126 MW
Cross shareholding in hydropower projects RATCH ช. การช่าง ทางด่วน กรุงเทพฯ ทีม คอนซัล GMS Power สปป. ลาว MDX 25% 28.5% 12.5% 1% 25% 27.5% 22.5% เซาอีสท์ เอเชีย เอนเนอจี 60% 45% 55% 20% 29% น้ำงึม 3 440 MW น้ำงึม 2 454 MW น้ำบาก 1 น้ำบาก 2 ห้วยเฮาะ 126 MW เทิน-หินบุน 220 MW EGCO อิตาเลี่ยน ไทย สปป. ลาว กฟผ. ศูนย์อุตสาหกรรม โรจนะ MHW 40% 25% 15% 20% 20% 25% 15% 25% 25% น้ำเทิน1 523 MW น้ำเทิน2 920 MW น้ำเงี๊ยบ 260 MW น้ำโม 105 MW
Trends in financing: • IFIs more or less irrelevant in Thailand and becoming irrelevant in Mekong • Less debt, more equity • PTTEP, PTT -> DE ratio = 1:1 • Driven by massive profits, high cashflows • Debt: less loan, more bonds issued Greater reliance on the stock/bond markets for financing for greater control by energy companies. Savings also shifted from traditional bank deposits to investment in securities (shares and bonds)
PTT debt profile (2006) Million Baht • Debt – Baht 52,940.73 • Debt – foreign currency 29,315.14 • Bonds – Baht 72,181.70 • Bonds – foreign currency 43,327.16 • Contracted loans 574.58 • Total 198,339.31 Lending by financial institutions being replaced by debt raised directly from disperse investors in bond markets, giving energy companies greater control and bargaining power over capital
Implications for advocacy work • Much more attention needed on governance of the stock/bond markets • Disclosure of foreign funds • Conflict of interest • Not sufficient to focus on governance of investment/financing (e.g. concession agreement, lending institutions) • Need to go after policy makers, monopoly energy companies to improve planning process & sector governance, and eliminate unnecessary investments