Download
1 / 26
300 likes | 473 Views
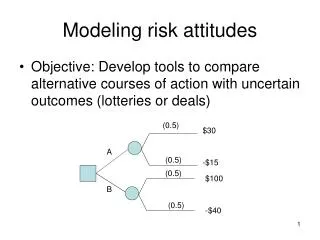
Risk Modeling. The Tropos Approach PhD Lunch Meeting 07/07/2005 Yudistira Asnar – yudis.asnar@dit.unitn.it. Definition. Failure: The inability of a system or component to perform its required functions within specified performance

E N D
Risk Modeling The Tropos Approach PhD Lunch Meeting 07/07/2005 Yudistira Asnar – yudis.asnar@dit.unitn.it
Definition • Failure: The inability of a system or component to perform its required functions within specified performance • Failure mode: The physical or functional manifestation of a failure • Model of Risk: Likelihood, but also effect of the failure Risk = Likelihood * Severity • Severity: [0,5] • Likelihood: [0,1]
Objective of Risk Analysis • Traditionally: • Find the most effective and efficient set of mitigation plans such that the risk can be manageable Strategy of choosing option • Increasing Quality of System (Reliability, Safety, Available, etc) • Tropos Approach: The evaluation of the best solution must be based on • Adopt traditional ones • REAL Cost is the cost of achieving main goals and the cost of associated Mitigation Plans • This means selecting subgoals taking into account their risks and the associated mitigation plans • We should optimize not only one of them, but both at the same time
Basic Assumption • Failure Mode-Risk can be associated with Objective-Asset Tropos: Goal, Task/Plan, Resource • Property of Assets (Necessary): • Rank • Threshold (Confidence Level): • Denial Likelihood (DL) [0,1] • Satisfaction Level (SL) [0,100]
Risk Analysis Scenario • Given Threshold of each assets • Find the most efficient set of solutions, that can be acceptable for given threshold (satisfaction level and denial likelihood) • Given Budget for accomplishment • Find the set of solutions (Assets and Mitigation) with the highest satisfaction level and the least denial likelihood • How much does it cost for achieving the highest satisfaction and confidence level • Etc.
Computing Impact • Top-Level Goals are annotated with their importance (Imp), that define by user • Leaf-Goal has rank (R), value that come form the function. It calculates order among all of them. • Failure modes are annotated with likelihood (L), a.k.a probability, and severity (S) • Links between failure modes and goals are annotated with Impact (I)[-20,20] (e.g. Satisfaction reduction)
Computing Impact • The risk of a goal G is computed as Possibility of Loss (PL) PLG = RG * ΣG (S * L * |I|) ; I ≤ 0 • Mitigation Plans are chosen in order to reduce PLG, until acceptable value • PLG is acceptable if PLG≤ RG * SL * DL • If there is no mitigation plan for it, we can de-idealize (Confidence Level) of the least importance goal • How much we can do de-idealize?
Defining Importance • Propagation Importance of Top-Level Goal (value: 1, 2, 3, etc., the bigger means more important) • Set of Goals with the cheapest cost of satisfaction of top level goal • Rules:[??] • And-Decomposition: AND(G1,G2) G3 • ImpG1=ImpG2=ImpG3 • CostG3 = CostG1+CostG2 • Or-Decomposition: OR(G1,G2) G3 • ImpG3=1; ImpG2=[1,2)and ImpG3=[1,2) needs more precise • CostG2 > CostG1↔ ImpG2 < ImpG1 • CostG3 = Min(CostG1,CostG2) • G3 is sub goal of G1 and G2 • ImpG3= Max(ImpG3-G1,ImpG3-G2)
Failure Mode • Failure Mode contribute to Intermediate Goal, not just leaf goal • Failure modes can contribute not only to goals but to other failure modes • Failure Mode is traditionally represented as an isolated event, but in reality, there is interrelation among failure modes • Failure Mode property: • Severity and Likelihood
Failure Mode • Contribution of FM1 to FM2, depends on the intrinsic risk of FM1 and the weight of edge connecting FM1 to FM2 • Contribution among FMs can be meant: • Modifying Likelihood • Modifying Severity • Weight of edge should represent both • Traditional Fault Trees are incomplete and faults should be represented as graphs
Computing Risk • In Case Study: • Contribution of Explosive User Added means increasing just likelihood of Limited Key Space • R Original Risk, R’ Contributed Risk, R” Mitigated Risk • R2” R2* M1 • R1” R1’ * M2 • R1’ R1+ R2”
Failure Mode Identification • Goal has 2 dimension: Satisfy and Maintain • Failure Mode of Goal (Negative-Goal) • Undesired thing • Something that not suppose to be maintained • Undesired Thing • Set-Theory • A’ = U – A • What is the Universe? [??] • Context • Domain • Something that not suppose to be maintained[??]
Mitigation Plan • Mitigations are set of actions to reduce (Likelihood and Severity) of Failure Mode • Likelihood ≤ Threshold Denial-Likelihood • Severity * Impact ≤ Threshold Satisfaction-Level • One mitigation action can reduce the one risk and can also increase the other risk • Choosing plan with considering • Severity Level of Risk • Some mitigation plan give the same effect to one particular failure mode
Mitigation Plan • Mitigations are annotated with Costs (C), Category (Transfer, Prevention, Detection, Retention, Alleviation, etc) • Link between mitigation and failure mode is annotated as Effect (E)(e.g. reduce/increase the risks) • Mitigation Plan Analysis • And-Or Decomposition • Positive-Negative Contribution • Mitigation Plan contribute to Goal, instead of Failure Mode • Mitigation Plan can fail • Introducing concept of time constrain to satisfy goal and to accomplish mitigation
Mitigation Plan Identification • Based on experience and repository • [??]
Re-Writing Tree • Solution to satisfy G1 and G6 • S1: G3,G4,G8 • S2: G3,G5,G8 • S3: G3,G4,G9,G10 • S4: G3,G5,G9,G10
Classic Approach • Top-Down
Approach to Solve • Classic: Top-Down Bottom-Up Adjustment • Re-Writing Tree
Re-Writing Tree • S1: G3,G4,G8 + M1,M2,M3 • S2: G3,G5,G8 + M2,M3 • S3: G3,G4,G9,G10 + M1,M2,M3,M4 • S4: G3,G5,G9,G10 + M2,M3,M4
Re-Writing Tree • Find all possible set goal solutions to satisfy top-level goal • Find all Mitigation Plans that is reachable from set goal solution • Calculate (Cost, Confidence Level) all possible combination between set goal solutions and all subset of mitigation plans • Needs something to reduce the search space