Download
1 / 22
220 likes | 318 Views
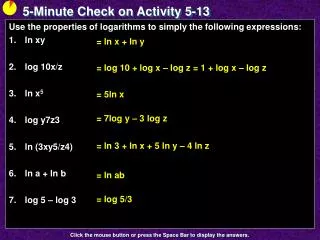
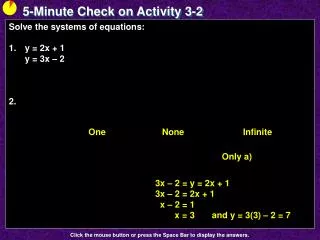
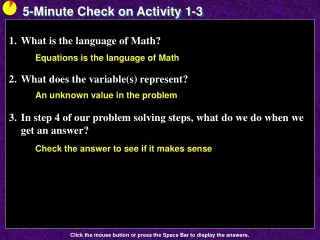
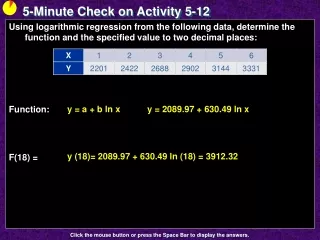
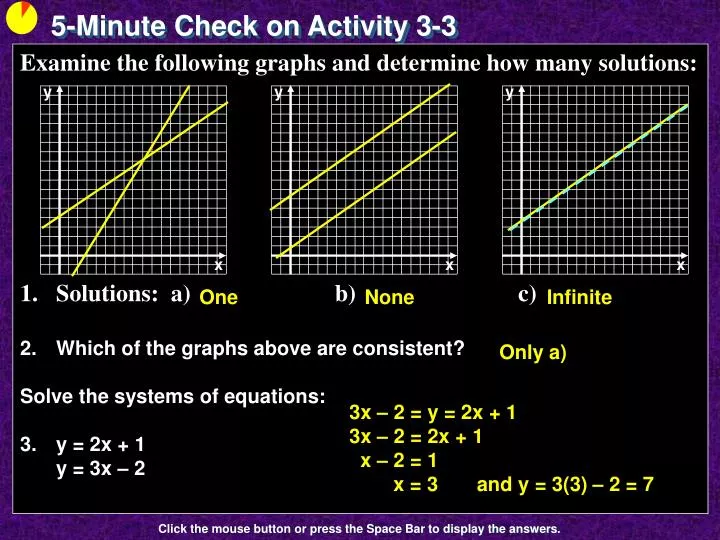
5-Minute Check on Activity 3-3. y. y. y. Examine the following graphs and determine how many solutions: Solutions: a) b) c) Which of the graphs above are consistent? Solve the systems of equations: y = 2x + 1 y = 3x – 2. x. x. x.

E N D
5-Minute Check on Activity 3-3 y y y • Examine the following graphs and determine how many solutions: • Solutions: a) b) c) • Which of the graphs above are consistent? • Solve the systems of equations: • y = 2x + 1y = 3x – 2 x x x One None Infinite Only a) 3x – 2 = y = 2x + 1 3x – 2 = 2x + 1 x – 2 = 1 x = 3 and y = 3(3) – 2 = 7 Click the mouse button or press the Space Bar to display the answers.
Activity 3 - 4 How Long Can You Live?
Objectives • Solve linear inequalities in one variable numerically and graphically • Use properties of inequalities to solve linear inequalities in one variable algebraically • Solve compound inequalities in one variable algebraically and graphically • Use interval notation to represent a set of real numbers by an inequality
Vocabulary • Inequality – a relationship in which one side can be greater or less than the other (equal as well) • Compound inequality – an inequality involving to inequality signs (like 3 < x < 9) • Closed interval – end points are included (≥ ≤) • Open interval – end points are not included ( > < )
English Phases to Math Symbols x > 10 x < 10 x ≥ 10 x ≤ 10 • x is greater than 10 • x is less than 10 • x is at least 10 • x is at most 10
Solving Inequalities Solving an inequality in one variable is the process of determining the values of the variable that make the inequality a true statement. These values are called the solutions of the inequality. If we had the solution to a pair of equalities (lines from previous lessons), then it was the point of intersection. With inequalities, if we have a solution, then we have a region of lots of points that satisfy the inequalities. We will use the same properties of Equality to solve the inequalities algebraically.
Solving Inequalities x – 3 + 3 < 5 + 3 x < 8 x + 6 – 6 < 10 – 6 x < 4 x < 10 – 6 x < 4 7 < x x > 7 • Any action you apply to one side of an inequality must be applied to the other side to keep the inequality in balance • We can add the same number to both sides • We can subtract the same number from both sides • We can simplify one or both sides • We cannot interchange the sides (we flip the inequality!)
How Long Can You Live? Life expectancy in the United States is steadily increasing, and the number of Americans aged 100 or older will exceed 850,000 by the middle of this century. Medical advancements have been a primary reason for Americans living longer. Another factor has been the increased awareness of maintaining a healthy lifestyle.
How Long Can You Live? The life expectancies at birth for women and men born after 1975 can be modeled by the following functions: W(x) = 0.106x + 77.01 M(x) = 0.200x + 68.94 where W(x) represents the life expectancy for women, M(x) represents the life expectancy for men, and x represents the number of years since 1975 that the person was born. That is, x = 0 corresponds to the year 1975, x = 5 corresponds to 1980, and so forth.
How Long Can You Live? (cont) The life expectancies at birth for women and men born after 1975 can be modeled by the following functions: W(x) = 0.106x + 77.01 M(x) = 0.200x + 68.94 Complete the following table: 77.01 77.54 78.07 78.60 79.13 79.66 68.94 69.94 70.94 71.94 72.94 73.94
How Long Can You Live? (cont) The life expectancies at birth for women and men born after 1975 can be modeled by the following functions: W(x) = 0.106x + 77.01 M(x) = 0.200x + 68.94 When will men overtake women in life expectancies? When will M(x) > W(x)? We can solve it one of three ways: 1) Using a table in our calculator 2) Using the graphing capability of our calculator 3) Solve it algebraically
How Long Can You Live? - Table The life expectancies at birth for women and men born after 1975 can be modeled by the following functions: W(x) = 0.106x + 77.01 M(x) = 0.200x + 68.94 When will men overtake women in life expectancies? When will M(x) > W(x)? Table
y How Long Can You Live? - Graph The life expectancies at birth for women and men born after 1975 can be modeled by the following functions: W(x) = 0.106x + 77.01 M(x) = 0.200x + 68.94 When will men overtake women in life expectancies? When will M(x) > W(x)? Graph x 10 20 30 40 50 60 70 80 90
How Long Can You Live? - Alg The life expectancies at birth for women and men born after 1975 can be modeled by the following functions: W(x) = 0.106x + 77.01 M(x) = 0.200x + 68.94 When will men overtake women in life expectancies? When will M(x) > W(x)? Algebraically M(x) > W(x) 0.200x + 68.94 > 0.106x + 77.01 Substitute 0.200x > 0.106x + 8.07 - 68.94 0.094x > 8.07 - 0.106x x > 85.852 0.094
Algebraic Properties • Given a < b thenAddition and Subtraction POE keeps the inequality true (a k < b k)Multiplication or Division by a positive number keeps the inequality true (ka < kb, if k > 0)Multiplication or Division by a negative number reverses the inequality (ka > kb, if k < 0)
Algebraic Properties: Examples then x – 2 + 2 > 9 + 2 x > 11 then x + 6 – 6 ≤ 8 - 6 x ≤ 2 then (6x) / 6 < (24/6) x < 4 then 2 ½x ≥ 23 x ≥ 6 then -1-y > -15 y < -5 • If x – 2 > 9 • If x + 6 ≤ 8 • If 6x < 24 • If ½x ≥ 3 • If -y > 5
Compound Inequalities • When a variable is between two numbers, then it is called a compound inequality • Remember the English translations! • Examine the following table:
Compound Inequalities: Examples • Solve the following compound inequalities: - 4 < 3x + 5 ≤ 11 1 < 3x – 2 < 4 - 5 - 5 - 5 -9 < 3x ≤ 6 3 3 3 -3 < x ≤ 2 + 2 + 2 + 2 3 < 3x < 6 3 3 3 1 < x < 2
Interval Notation • Closed Interval: denoted by [ ] means the endpoints are included • Open Interval: denoted by ( ) means the endpoints are not included • Half open or Half closed: denoted by ( ] or [ ) means one endpoint is included and the other is not (base on open and closed above) • Unbounded: denoted by - or means that an interval can go as low as negative infinity (- ) or that an interval can go as high as positive infinity ()
Interval Notation: Examples • Write the inequalities in interval notation: 1 < x < 2 -9 < x < 12 x ≤ 3 • Write the interval notations as an inequality: [-2 , 4) (2, 8) (5, ) (1, 2) (-9, 12) (-, 3] -2 ≤ x < 4 2 < x < 8 5 < x
Inequalities and Number Lines • x > 4 • x < 3 • x ≥ -1 • x ≤ 0 • x = 2 (4, ) 1 1 -3 -3 1 2 2 -2 2 -2 3 -1 3 3 -1 4 0 4 4 0 1 1 5 5 5 2 6 6 6 2 3 7 7 3 7 (-, 3) -1, ) (-, 0] [2, 2]
Summary and Homework • Summary • The solution set of an inequality in one variable is the set of all values of the variable that satisfy the inequality. • The direction of an inequality is not changed when • Same quantity is added to or subtracted from both sides of the inequality, or • Both sides of an inequality are multiplied or divided by the same positive number. • Homework • pg 330 – 335; 4-8, 19, 20