Download
1 / 57
570 likes | 705 Views
Diffuse Pollution and Environmental Water Quality Regulations. A Seminar Presentation Presented to the: Students and Faculties of Dept of Civil Engineering Sharif University of Technology May 10 2008. By: Masoud Kayhanian Department of Civil and Environmental Engineering

E N D
Diffuse Pollution and Environmental Water Quality Regulations A Seminar Presentation Presented to the: Students and Faculties of Dept of Civil Engineering Sharif University of Technology May 10 2008 By: Masoud Kayhanian Department of Civil and Environmental Engineering University of California at Davis دانشگاه صنعتی شریف
Outline • Part I: Water Quality Standards • U.S. Clean Water Act • Part II: Application of Water Quality Regulations on Lake Tahoe Clarity Issue • Part III: Water Quality Concern of Caspian Sea and Potential Implication of Water Quality Standard (pollutant discharge limits)
Part II: Water Quality Regulations • Nearly all worldwide water quality regulations are based on the standards established under the U.S. Clean Water Act • U.S. Clean Water Act is Regulated by U.S. Environmental Protection Agency (USEPA) • Many other developed and developing countries have now established their own branch of EPA using the USEPA as their model (i.e. British EPA, Canadian EPA, Taiwan EPA) • Water quality standards in the U.S.A. are the most stringent compared with the rest of the world
U.S. “Clean Water Act” was established in 1972 “The objective of this Act is to restore and maintain the chemical, physical, and biological integrity of the Nation’s waters.” Originally focused on point source pollution, treatment plant upgrades etc. Section 305(b) - requires that states assess their water quality biennially and report those findings to the EPA. Section 303(d) - requires states to identify a list of impaired waters and develop allocations of the maximum amount of a pollutant each impaired water body can receive and still meet water quality standards. Total Maximum Daily Load or TMDL.
Fundamental Goal of U.S. Clean Water Act Protecting the Beneficial Uses of the waters of the state for: • Direct Human Uses • Recreation Uses • Fishing Uses • Aquatic Habitat Uses • Non-Aquatic Habitat Uses • Special Uses
Water Quality Regulation Beneficial Uses Technology Standards Water Quality Objectives Permit Requirements Effluent Standards Scientific Data & Other Information
Setting WQ Objectives Examples • Toxicity = causing disease or death • Assess toxicity by exposing test organisms to varying concentrations for varying times
Water Column Test Species Fresh water organisms are selected based on their sensitivity to pollutants Topsmelt Mysid Shrimp Cladocerans Sea Urchin embryos/gametes Bivalve embryos Courtesy of Steve Bay, SCCWRP
Sediment Column Test Species Sediment organisms are selected based on their sensitivity to pollutants Amphipods Insect Larvae Polychaetes Courtesy of Steve Bay, SCCWRP
Toxicity Testing • Acute tests -- 24 to 96 hr • Example: 96-h LC50 • Lethal Concentration for 50% of the organisms in a 96-hour test • Chronic tests -- varying times; often 7 d • Test results are basis for WQ Objectives
Water Quality Objectives • Numerical • Example: Effluent concentration limit of 0.1 mg/L total phosphorus (Lake Tahoe) • Narrative • Example: Water shall not contain bio-stimulatory substances in concentrations that promote aquatic growth to the extent that such growth causes nuisance or adversely affects beneficial uses.
In Summary: Water quality objectives and regulations are developed to protect the receiving water bodies (i.e., rivers, lakes, oceans) Courtesy of Steve Bay, SCCWRP
Water Quality Regulations are Applied to Pollution Produced from Both • Point sources • Non-Point Sources
Point Source Pollution • Point Sources • “End-of-pipe”; occurs at an identifiable location (“you can point to it”) Examples: • Municipal wastewater treatment plant discharges • Industrial waste discharges • Some storm sewer discharges Photo Source: George Tchobanoglous
Non-Point Sources of Pollution • Non-Point Sources • Poorly-defined; diffuse; hard to spot; occurring over a distributed area • Examples: • Agricultural runoff • Mine drainage (if not in pipes) • Logged areas in forests • Co-mingled stormwater runoffs
100 80 60 1971 - 1972 40 20 Percent Contribution to Ocean 0 100 Urban Runoff 80 POTW Wastewater 60 40 1994 - 1995 20 0 Zinc Flow Lead Nickel Copper Chromium Suspended Solids Source: SCCWRP Ammonia
Part II: Implication of Environmental regulations to restore the Lake Tahoe clarity Lake Tahoe in California/Nevada border, United State of America (USA)
Lake Tahoe Physical Characteristics • Lake dimension: 35 m long and 19 km wide • Shoreline = 116 km • Surface area = 495 Km2 • Maximum depth = 501 m • 2/3 in California and 1/3 in Nevada • Located at about 2270 m above sea level • Inflow water supplies = snowmelt from surrounding mountains • Outflow = Truckee river and maintained by a small dam controlling the top 1 m of lake
Approach Used to Tackle the Clarity Problem • Discharge requirement mandate (TN, TP, Fine particles) • Total Maximum Daily Load (TMDL) • Public outreach/government support • Public education • Higher government official support • Laboratory and supporting facilities for research and development
KEEPING TAHOE BLUE IS NOT JUST A CATCHY SLOGAN IT’S THE LAW!
IMPORTANT GOVERNMENT SUPPORTS from the Governor of California and President of the United States of America
Establishment of the UC Davis Tahoe Environmental Research Center (TERC) • Principal focus of the TERC • conducts research, education and public outreach on lakes and their surrounding watersheds and airsheds. • provides objective scientific information for restoration and sustainable use of the Lake Tahoe Basin.
Satellite Measurements • Thermal Infrared (TIR) Sensors • Skin Temperature • MODIS – MODerate Resolution Imaging Spectroradiometer • 1000 m resolution (TIR) • 0.5 day repeat time (each sensor) • Terra & Aqua (4 images/day) • ASTER – Advanced Spaceborne Thermal Emission Spectrometer • Terra (“zoom lens”) • 90 m resolution (TIR) • 16 day repeat time • Landsat ETM+ – Enhanced Thematic Mapper Plus • 60 m resolution (TIR) • 16 day repeat time • ~40 min. ahead of Terra REMOTE SENSING
Lake Tahoe TMDL Water Clarity Restoration Plan Science Approach • What are sources and relative contributions of “contaminants” causing clarity decline? • How much of a reduction is needed to achieve the desired conditions? • How will this reduction be achieved?
Source Categories 1. Stream Channel & Shoreline Erosion 2. Urban and Non-Urban 3. Groundwater 4. Atmospheric
Fine Particles < 20 microns 5x10²⁰/year
Lake Tahoe TMDL Water Clarity Restoration Plan Science Approach • What are sources and relative contributions of nutrients and fine-sediments? • How much of a reduction is needed to achieve the desired conditions? Modeling approach • How will this reduction be achieved?
Atmospheric Atmospheric Land Use Land Use Deposition Deposition Secchi Depth Inorganic Algal Lake Tributaries Tributaries Light Scattering & Absorption Particles Growth N, P, Si Climate, Climate, Groundwater Loss Loss Particle Fate Model Optical Model Ecological Model Precipitation Precipitation DLM Hydrodynamic/Thermodynamic Model Lake Tahoe Model Framework
Base Case Do Nothing More in an Unchanging World Calibration and validation years (1999-2004)
Test Case 1 – 55% Load Reduction All Sources, All loads, 20 year Phase-in
Test Case 2 – 75% Load Reduction Urban Sources, All loads, 20 year Phase-in
Lake Tahoe TMDL Water Clarity Restoration Plan Science Approach • What are sources and relative contributions of nutrients and fine-sediments? • How much of a reduction is needed to achieve the desired conditions? • How will this reduction be achieved?
There are a multitude of ways to achieve a specific clarity target Parameters are for illustrative purposes only % Nitrogen Reduction 100 90 80 70 60 50 40 30 20 10 0 0 10 20 30 % Sediment Reduction 40 50 60 70 80 90 Final Secchi Depth (m) 100 0 20 - 25………Red 10 20 - 25………Red 20 30 40 25.5 - 28…….Yellow 25.5 - 28…….Yellow 50 60 70 80 % Phosphorus Reduction 28.5 - 32.5…..Blue 28.5 - 32.5…..Blue 90 100 33 & above..Purple 33 & above..Purple
Creation of Load Reduction Matrix Based on Evaluation of Basin-Wide Pollutant Control Opportunities http://www.swrcb.ca.gov/rwqcb6/TMDL/Tahoe/docs/presentations/pro_report_v1_01.pdf
Part III: Pollution sources and of Caspian sea and potential implication of water quality discharge limits Caspian Sea bordering with Russia, Turkmenistan, Azerbaijan, Kazakhstan, and Iran
Physical Characteristics of Caspian Sea • Total cost line = 7000 km • Surface area = 386,400 km2 • Volume of the lake = 78, 700 km3 • Salt content = slightly salty; 3 times less salt compare to ocean water • Most input water from north, west and south • Over 90% of the inflowing freshwater is supplied by the 5 largest rivers: Volga – 241 km3, Kura – 13 km3, Terek – 8.5 km3, Ural – 8.1 km3 and Sulak 4 km3. • The Iranian rivers and the smaller streams on the western shores supply the remaining 10% of inflow freshwater
Environmental Problems/Issues Source: http://www.caspianenvironment.org
Sources of Pollution • Land-Based Pollution through Rivers • Chemical Industries • Domestic wastewaters • Solid waste • Offshore Pollution • Oil production
Domestic Wastewater Pollution • Warm water from power plants including nuclear reactors • Wastewater from desalinization facilities • Treated and untreated water from domestic and industrial factories • Contaminated sludge • Runoff from industries • Runoff from agricultural activities including animal manure • Runoff from roads
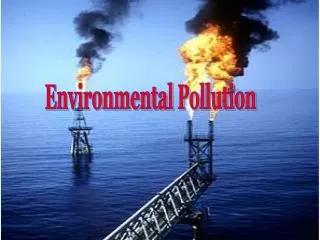
Offshore Pollution Sources • Leakage of oil from offshore oil production • Crud oil discharges from ships • Contamination: • Surface water contamination • Sediment contamination
Major Rivers Discharging Pollution to Caspian Sea • Kura • Volga • Sulak • Terek • Samur • Ural Photos by: Bita Ayati
Pollution Load Discharged by all Rivers • 80-97% of total pollutant load discharge to the Caspian Sea are through Rivers Source: http://www.caspianenvironment.org
Annual BOD input to Caspian Sea by all Rivers Source: Bita Ayati, 2003; presented to MAB-UNESCO
Annual TPH input to Caspian Sea by all Rivers Source: Bita Ayati, 2003; presented to MAB-UNESCO
Annual Cd input to Caspian Sea by all Rivers Source: Bita Ayati, 2003; presented to MAB-UNESCO