Download
1 / 14
150 likes | 299 Views
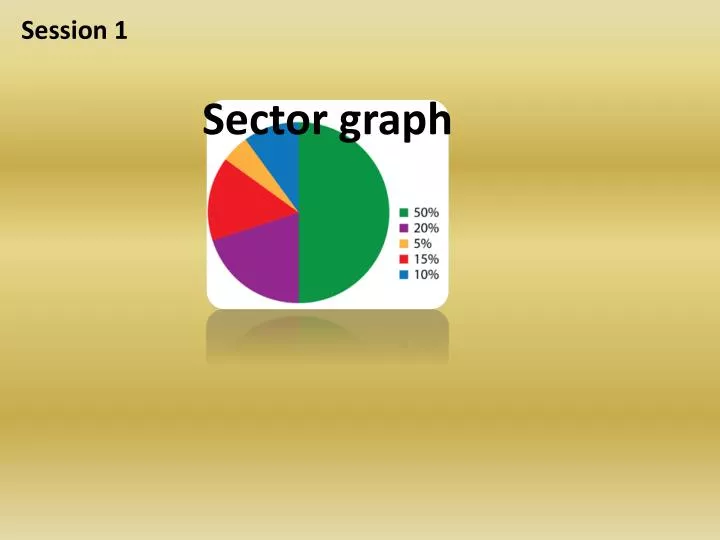
Session 1. Sector graph. Use sectors of a circle to show sizes of parts. Sector graph. Pie chart. Circle graph. Why circle graph/pie chart?. T he circle provides a visual concept of the whole (100%). Circle graphs/pie charts are simple to use.

E N D
Session 1 Sector graph
Use sectors of a circle to show sizes of parts Sector graph Pie chart Circle graph
Why circle graph/pie chart? • The circle provides a visual concept of the whole (100%). • Circle graphs/pie charts are simple to use.
Sector graphs are used when there are no more than six components only—otherwise, the resulting picture will be too complex to understand.
Sector graphs are used when there are no more than six components . Sector graph or pie chart Title Key • Graph Title – the title tells what the graph is representing. Percentage 20% Sectors Labels • Sectors – Each sector is one part of the whole circle. It represents a particular category. • Sector Labels – Each label tells what the sector represents. Six types of sports are shown on the sector graph
A group of 70 students was surveyed to find the group’s favourite sport. The results are shown below:
Calculate the angle size What you should know before calculating the angle size. 1- What is the total number of people surveyed: 80 2- How many degrees are in a revolution: 360 Calculate the angle size: 1- Write the number of people who chose the first sport as a fraction : 13 (the number of viewers for Australian football). 2- Divide by 80 ( the total number of people surveyed) 3- Times by 360 ( degrees in a revolution). Example Calculate the angle size for Australian football: x 360 =58.5 Number of people who chose Australian football Total number of people surveyed
Calculate the angle size for cricket: Write the number of people who chose the the first sport on top Divide by 80 ( the total number of people surveyed Times by 360 ( revolution). • x 360 = Number of people who chose cricket Total number of people surveyed
Calculate the angle size for Motor Racing Write the number of people who chose the the first sport on top Divide by 80 ( the total number of people surveyed Times by 360 ( revolution). • x 360 = Number of people who chose cricket Total number of people surveyed
Calculate the angle size for Rugby League Write the number of people who chose Rugby League on top (numerator) Divide by 80 ( the total number of people surveyed) (denominator) Times by 360 ( revolution). • x 360 = Number of people who chose cricket Total number of people surveyed
Calculate the angle size for Rugby Union Write the number of people who chose Rugby Union on top Divide by 80 ( the total number of people surveyed) Times by 360 ( degrees in a revolution). • x = Number of people who chose cricket Total number of people surveyed
Calculate the angle size for Soccer Write the number of people who chose soccer on top Divide by 80 ( the total number of people surveyed) Times by 360 ( degrees in a revolution). • x = Number of people who chose cricket Total number of people surveyed