Download
1 / 1

E N D
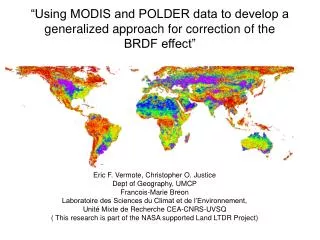
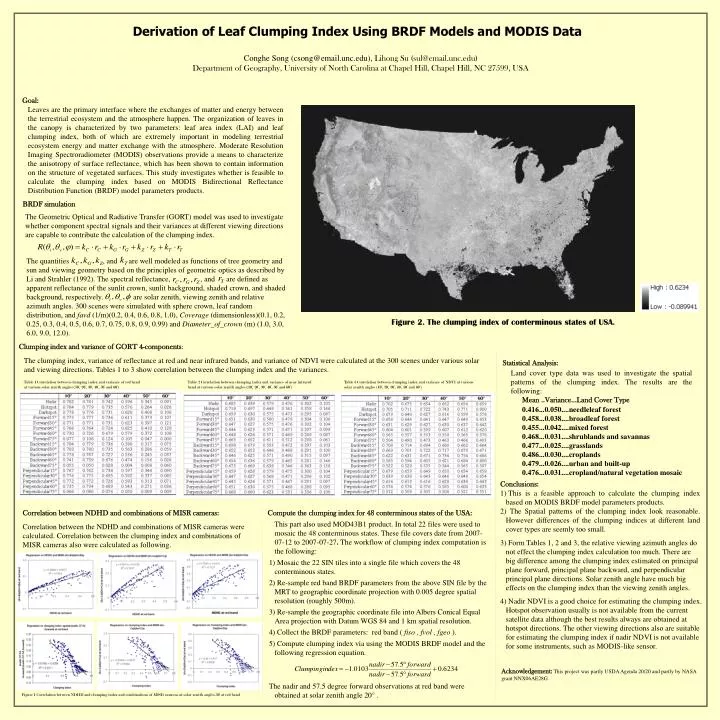
The quantities , and are well modeled as functions of tree geometry and sun and viewing geometry based on the principles of geometric optics as described by Li and Strahler (1992). The spectral reflectance, , and are defined as apparent reflectance of the sunlit crown, sunlit background, shaded crown, and shaded background, respectively. are solar zenith, viewing zenith and relative azimuth angles. 300 scenes were simulated with sphere crown, leaf random distribution, and favd (1/m)(0.2, 0.4, 0.6, 0.8, 1.0), Coverage (dimensionless)(0.1, 0.2, 0.25, 0.3, 0.4, 0.5, 0.6, 0.7, 0.75, 0.8, 0.9, 0.99) and Diameter_of_crown (m) (1.0, 3.0, 6.0, 9.0, 12.0). Derivation of Leaf Clumping Index Using BRDF Models and MODIS Data Conghe Song (csong@email.unc.edu), Lihong Su (sul@email.unc.edu) Department of Geography, University of North Carolina at Chapel Hill, Chapel Hill, NC 27599, USA Goal: Leaves are the primary interface where the exchanges of matter and energy between the terrestrial ecosystem and the atmosphere happen. The organization of leaves in the canopy is characterized by two parameters: leaf area index (LAI) and leaf clumping index, both of which are extremely important in modeling terrestrial ecosystem energy and matter exchange with the atmosphere. Moderate Resolution Imaging Spectroradiometer (MODIS) observations provide a means to characterize the anisotropy of surface reflectance, which has been shown to contain information on the structure of vegetated surfaces. This study investigates whether is feasible to calculate the clumping index based on MODIS Bidirectional Reflectance Distribution Function (BRDF) model parameters products. BRDF simulation The Geometric Optical and Radiative Transfer (GORT) model was used to investigate whether component spectral signals and their variances at different viewing directions are capable to contribute the calculation of the clumping index. Figure 2. The clumping index of conterminous states of USA. Clumping index and variance of GORT 4-components: The clumping index, variance of reflectance at red and near infrared bands, and variance of NDVI were calculated at the 300 scenes under various solar and viewing directions. Tables 1 to 3 show correlation between the clumping index and the variances. Statistical Analysis: Land cover type data was used to investigate the spatial patterns of the clumping index. The results are the following: Mean ..Variance…Land Cover Type 0.416...0.050....needleleaf forest 0.458...0.038....broadleaf forest 0.455...0.042....mixed forest 0.468...0.031....shrublands and savannas 0.477...0.025....grasslands 0.486...0.030....croplands 0.479...0.026....urban and built-up 0.476...0.031....cropland/natural vegetation mosaic Table 1 Correlation between clumping index and variance of red band at various solar zenith angles (10°, 20°, 30°, 40°, 50° and 60°) Table 2 Correlation between clumping index and variance of near infrared band at various solar zenith angles (10°, 20°, 30°, 40°, 50° and 60°) Table 3 Correlation between clumping index and variance of NDVI at various solar zenith angles (10°, 20°, 30°, 40°, 50° and 60°) • Conclusions: • This is a feasible approach to calculate the clumping index based on MODIS BRDF model parameters products. • 2) The Spatial patterns of the clumping index look reasonable. However differences of the clumping indices at different land cover types are seemly too small. • 3) Form Tables 1, 2 and 3, the relative viewing azimuth angles do not effect the clumping index calculation too much. There are big difference among the clumping index estimated on principal plane forward, principal plane backward, and perpendicular principal plane directions. Solar zenith angle have much big effects on the clumping index than the viewing zenith angles. • 4) Nadir NDVI is a good choice for estimating the clumping index. Hotspot observation usually is not available from the current satellite data although the best results always are obtained at hotspot directions. The other viewing directions also are suitable for estimating the clumping index if nadir NDVI is not available for some instruments, such as MODIS-like sensor. Correlation between NDHD and combinations of MISR cameras: Compute the clumping index for 48 conterminous states of the USA: This part also used MOD43B1 product. In total 22 files were used to mosaic the 48 conterminous states. These file covers date from2007-07-12 to 2007-07-27. The workflow of clumping index computation is the following: 1) Mosaic the 22 SIN tiles into a single file which covers the 48 conterminous states. 2) Re-sample red band BRDF parameters from the above SIN file by the MRT to geographic coordinate projection with 0.005 degree spatial resolution (roughly 500m). 3) Re-sample the geographic coordinate file into Albers Conical Equal Area projection with Datum WGS 84 and 1 km spatial resolution. 4) Collect the BRDF parameters: red band ( fiso , fvol , fgeo ). 5) Compute clumping index via using the MODIS BRDF model and the following regression equation. The nadir and 57.5 degree forward observations at red band were obtained at solar zenith angle 20° . Correlation between the NDHD and combinations of MISR cameras were calculated. Correlation between the clumping index and combinations of MISR cameras also were calculated as following. Acknowledgement:This project was partly USDA Agenda 20/20 and partly by NASA grant NNX06AE28G. Figure 1 Correlation between NDHD and clumping index and combinations of MISR cameras at solar zenith angles 30° at red band