Download
1 / 1
10 likes | 106 Views
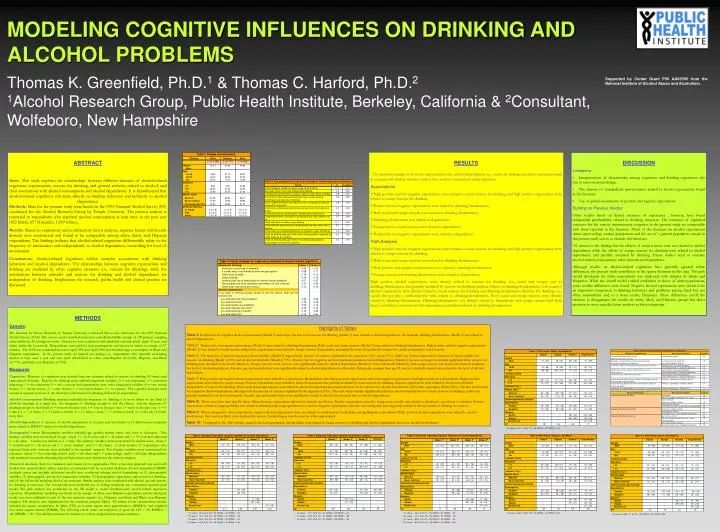
MODELING COGNITIVE INFLUENCES ON DRINKING AND ALCOHOL PROBLEMS Thomas K. Greenfield, Ph.D. 1 & Thomas C. Harford, Ph.D. 2 1 Alcohol Research Group, Public Health Institute, Berkeley, California & 2 Consultant, Wolfeboro, New Hampshire.

E N D
MODELING COGNITIVE INFLUENCES ON DRINKING AND ALCOHOL PROBLEMS Thomas K. Greenfield, Ph.D.1 & Thomas C. Harford, Ph.D.21Alcohol Research Group, Public Health Institute, Berkeley, California & 2Consultant, Wolfeboro, New Hampshire Supported by Center Grant P50 AA05595 from the National Institute of Alcohol Abuse and Alcoholism . ABSTRACT Aims. This study explores the relationships between different domains of alcohol-related cognitions (expectations, reasons for drinking, and general attitudes related to alcohol) and their associations with alcohol consumption and alcohol dependence. It is hypothesized that alcohol-related cognitions will relate directly to drinking behaviors and indirectly to alcohol dependence. Methods. Data for the present study were based on the 1995 National Alcohol Survey (N9) conducted for the Alcohol Research Group by Temple University. The present analysis is restricted to respondents who reported alcohol consumption at least once in the past year (822 blacks, 857 Hispanics, 1,069 whites). Results. Based on exploratory and confirmatory factor analyses, separate factors within each domain were constructed and found to be comparable among white, black, and Hispanic respondents. The findings indicate that alcohol-related cognitions differentially relate to the frequency of intoxication and independently to alcohol dependence, controlling for level of intoxication. Conclusions. Alcohol-related cognitions exhibit complex associations with drinking behaviors and alcohol dependence. The relationships between cognitive expectations and drinking are mediated by other cognitive elements (i.e., reasons for drinking), while the associations between attitudes and reasons for drinking and alcohol dependence are independent of drinking. Implications for research, public health and clinical practice are discussed. • RESULTS • The conceptual paradigm in the present study postulated that alcohol-related cognitions (i.e., reasons for drinking and alcohol expectancies) would be associated with drinking behaviors, which in turn, would be associated with alcohol dependence. • Associations • High positive and low negative expectancies were related to social reasons for drinking and high positive expectancies were related to escape reasons for drinking. • Positive but not negative expectations were related to drinking/drunkenness. • Both social and escape reasons were related to drinking/drunkenness. • Drinking/drunkenness was related to dependence. • Escape but not social reasons were related to dependence. • Positive but not negative expectations were related to dependence. • Path Analysis • High positive and low negative expectancies were related to social reasons for drinking and high positive expectancies were related to escape reasons for drinking. • Both social and escape reasons were related to drinking/drunkenness. • Both positive and negative expectations were related to drinking/drunkenness. • Escape reasons and drinking drunkenness were related to dependence. High positive alcohol expectancies were directly related to reasons for drinking (i.e., social and escape) and to drinking/drunkenness, but partially mediated by reasons for drinking (indirect effects on drinking drunkenness). Low negative alcohol expectancies were directly related to social reasons for drinking and drinking/drunkenness. Reasons for drinking (i.e., social) did not play a mediating role with respect to drinking/drunkenness. Both social and escape reasons were directly related to drinking/drunkenness. Drinking/drunkenness was directly related to dependence and escape reasons had both direct and indirect associations with dependence, partially mediated by drinking/drunkenness. • DISCUSSION • Limitations • Interpretations of directionality among cognitions and drinking experiences dye due to cross-sectional design. • The absence of standardized questionnaires related to alcohol expectancies found in the literature. • Use of global assessments of positive and negative expectancies. • Building on Previous Studies • Other studies based on limited measures of expectancy , however, have found comparable predictability related to drinking measures. The estimates of explained variances for the various measurement categories in the present study are comparable with those reported in the literature. Much of the literature on alcohol expectancies draws upon college student populations and the use of a general population sample in the present study serves to extends this literature. • Of interest is the finding that the effects of social reasons were not related to alcohol dependence while the effects of escape reasons for drinking were related to alcohol dependence and partially mediated by drinking. Future studies need to examine alcohol-related consequences other than alcohol dependence. • Although studies on alcohol-related cognitions have generally ignored ethnic differences, the present study contributes to the sparse literature in this area. The path model developed for white respondents was replicated with samples of blacks and Hispanics. While the overall model yielded similarities to those of white populations, some notable differences were found. Negative alcohol expectancies were shown to be an important component in drinking behaviors and problems among black but not white respondents and, to a lesser extent, Hispanics. These differences justify the decision to disaggregate the models by white, black, and Hispanic groups but direct attention to more specific future analyses in these subgroups. METHODS Sample: The Institute for Survey Research of Temple University conducted face-to-face interviews for the 1995 National Alcohol Survey (NAS). The surveys used a stratified national household probability sample of 100 primary sampling units within the 48 contiguous states. Interviews were conducted with randomly selected adults (aged 18 years and older) within the household. Respondents were paid for their participation and interviews lasted an average of 67 minutes. The NAS was conducted between April 1995 and April 1996 and included large oversamples of Black and Hispanic respondents. In the present study we limited our analyses to respondents who reported consuming alcohol at least once a year and who were self-defined as white, non-Hispanic (n=1,069), Hispanic, non-Black (n=771), and black, non-Hispanic (n=822). Measures Cognitions. Measures of cognitions were derived from two domains related to reasons for drinking (10 items) and expectations (8 items). Reasons for drinking were ordered categorical variables (3 = very important, 2 = somewhat important, 1 = not important, 0 = not a reason) and expectations were order categorical variables (4 = very strong chance, 3 = strong chance, 2 = some chance, 1 = not much chance, 0 = no chance). The cognitive domains were located in separate sections of the interview, with reasons for drinking followed by expectations. Alcohol consumption. Drinking measures included the frequency of drinking 5 or more drinks of any kind of alcoholic beverage in a single day, the frequency of drinking enough to feel the effects, and the frequency of drinking enough to feel drunk (0 = never in the past year, 1 = once in the past year, 2 = twice in the past year, 3 = 3-6 times, 4 = 7-11 times, 5 = 1-3 times a month, 6 = 1-2 times a week, 7 = 3-4 times a week, 8 = every day or nearly every day). Alcohol dependence. A measure of alcohol dependence in the past year was based on 13 dichotomous symptom items related to DSM-IV criteria for alcohol dependence. Demographic status. Demographic variables included age, gender, marital status, and years of education. Two dummy variables were constructed for age where 1 = 18-34 years and 0 = all others and 1 = 55 years and older and 0 = all others. Gender was defined as 1 = male. Two dummy variables were constructed for marital status where 1 = married and 0 = all others and 1 = never married and 0 = all others. A small number of respondents who reported living with someone were included in the married category. Two dummy variables were constructed for education where 1 = less than high school and 0 = all others and 1 = some college and 0 = all others. Respondents with technical/vocational schooling beyond high school were included in the referent category. Statistical Analysis. Tests for mediation were based on two approaches. First, a two-step approach was used with models that assessed direct effects and then re-estimated with the potential mediators. Several hierarchical MIMIC (multiple causes and multiple indicators) models were conducted relating alcohol dependence to (1) demographic variables, (2) demographic and alcohol expectancy variables, (3) demographic, expectancy, and reasons for drinking, and (4) the full model including alcohol use measures. Similar analyses were conducted with alcohol use and reasons for drinking as outcomes. The second and more preferred way of testing mediation was a structural equation path model. The path analysis was conducted on the full model to model simultaneously several related regression equations. All preliminary modeling was based on the sample of white, non-Hispanic respondents and the final path model was cross-validated in each of the two minority samples (i.e., Hispanic, non-black and Black, non-Hispanic samples). The analyses were implemented in the computer program Mplus. Fit indices for the measurement models included chi square, comparative fit index (CFI), root mean square error approximation (RMSEA), and weighted root mean square residual (WRMR). The following culoff values are indicators of good fit: CFI > .95; RMSEA < .06; WRMR < .90. The default estimator for analysis is a robust weighted least squares estimator. Highlights of Tables Table 4.Positive but not negative alcohol expectancies (Model 2) and escape but not social reasons for drinking (Model 3) were related to alcohol dependence. As expected, drinking/drunkenness (Model 4) was related to alcohol dependence. Table 5: Positive but not negative expectancies (Model 1) were related to drinking/drunkenness. Both social and escape reasons (Model 2) were related to drinking/drunkenness. High positive and low negative expectancies (Model 3) were related to social reasons and positive expectancies were related to escape reasons. Expectancies accounted for twice the predicted variance for escape compared to social reasons. Table 6: The inclusion of alcohol expectancy latent variables (Model 2) improved the amount of variance explained by the regression (34% versus 17%), which was further improved by inclusion of latent variables for reasons for drinking (Model 3, 63%) and alcohol involvement (Model 4, 73%). Positive, but not negative, alcohol expectancy predicted alcohol dependence (Model 2) but was no longer statistically significant when reasons for drinking were included in the model (Model 3). Escape, but not social, reasons were significantly related to alcohol dependence (Model 3). In the full model (Model 4), both escape reasons and alcohol involvement predicted the level of alcohol dependence. Gender, age, and marital status were significantly related to alcohol dependence in all models. Being male, younger than age 55, and not currently married were related to the level of alcohol dependence. Table 7:Both positive and negative alcohol expectancies were related to social reasons. Respondents with higher positive expectancies and lower negative expectancies had higher levels for social reasons. Higher positive expectancies were related to escape reasons. Positive expectancies were related to alcohol involvement but partially mediated by social reasons for drinking. Negative expectancies were related to alcohol involvement independent of reasons for drinking. Both social and escape reasons were related to alcohol involvement and explained more of the variance for alcohol involvement (65%) than expectancy effects (25%). Alcohol involvement was related to alcohol dependence and improved the amount of variance explained by the regression (71%). The only other variable significantly related to alcohol dependence was escape reasons for drinking, which was partially mediated by alcohol involvement. Gender, age, and marital status were significantly related to alcohol involvement but not alcohol dependence. Table 8:There were three item specific direct effects between expectancies and reasons (results not shown). Positive expectations related to being more sociable were related to drinking is a good way to celebrate. Positive expectations related to forget problems was related to drinking helps forget problems as a reason. Negative expectations related to becoming sick were negatively related to the enjoyment of drinking as a reason. Table 9:When compared to white respondents, negative alcohol expectancies were not related to social reasons for drinking among Hispanic respondents. While positive alcohol expectations were related to alcohol involvement, they were less likely to be mediated by reasons for drinking as was the case for white respondents. Table 10:Compared to the other groups, negative alcohol expectancies among blacks were related to escape reasons for drinking and alcohol dependence but not to alcohol involvement. a Chi square = 199.1, 104 df, CFI = .98, RMSEA = .03, WRMR = 1.04. a Chi square = 58.6, 46 df, CFI = .99, RMSEA = .01, WRMR = .89 b Chi square = 91.2, 72 df, CFI = .99, RMSEA = .01, WRMR = .89. c Chi square = 108.9, 74 df, CFI = .99, RMSEA = .02, WRMR = .95 d Chi square = 105.9, 57 df, CFI = .99, RMSEA = .03, WRMR = 1.06 a Chi square = 121.5, 28 df, CFI = .98, RMSEA = .05, WRMR = 1.47. b Chi square = 145.4, 33 df, CFI = .97, RMSEA = .05, WRMR = 1.50. c Chi square = 189.7, 52 df, CFI = .97, RMSEA = .05, WRMR = 1.30. a Chi square = 58.6, 46 df, CFI = .99, RMSEA = .01, WRMR = .89 b Chi square = 91.2, 72 df, CFI = .99, RMSEA = .01, WRMR = .89 c Chi square = 108.9, 74 df, CFI = .99, RMSEA = .02, WRMR = .95 d Chi square = 105.9, 57 df, CFI = .99, RMSEA = .03, WRMR = 1.06 a Chi square = 206.3, 126 df, CFI = .98, RMSEA = .03, WRMR = 0.93. a Chi square = 238.0, 121 df, CFI = .98, RMSEA = .03, WRMR = 0.99