Download
1 / 18
180 likes | 392 Views
The Outlook for U.S. Natural Gas Markets. Guy Caruso, Administrator Energy Information Administration U.S. Department of Energy. 2007 U.S.-Algeria Energy Forum May 14, 2007 Washington, DC. Annual Energy Outlook 2007 reference case indicates that through 2030.

E N D
The Outlook for U.S. Natural Gas Markets Guy Caruso, Administrator Energy Information Administration U.S. Department of Energy 2007 U.S.-Algeria Energy Forum May 14, 2007 Washington, DC
Annual Energy Outlook 2007 reference case indicates that through 2030.... • U.S. energy demand is projected to grow at an average annual rate of 1.1 percent • The energy efficiency of the economy is projected to increase at an average annual rate of 1.8 percent • U.S. oil import dependency is projected to grow from 60 percent to 61 percent • U.S. natural gas use is projected to peak around 2020 • Future growth in U.S. natural gas supplies depends on unconventional domestic production, natural gas from Alaska, and liquefied natural gas imports • Carbon dioxide emissions are projected to grow at an average annual rate of 1.2 percent
World Oil Price, 1980-2030 (2005 dollars per barrel) History Projections High Price Reference Low Price Annual Energy Outlook 2007
U.S. Primary Energy Consumption by Fuel, 1960-2030 (quadrillion Btu) History Projections Liquid Fuels Coal Natural Gas Nuclear Renewables Annual Energy Outlook 2007
U.S. Natural Gas Wellhead Price, 1970-2030 (2005 dollars per thousand cubic feet) History Projections Annual Energy Outlook 2007
U.S. Natural Gas Consumption by Sector, 1990-2030 (trillion cubic feet) History Projections Industrial* Electric Power Residential Commercial Transportation** * Includes lease and plant fuel ** Includes pipeline fuel Annual Energy Outlook 2007
U.S. Natural Gas Production, Consumption, and Net Imports, 1960-2030 (trillion cubic feet) History Projections Consumption 21% Net Imports 16% Production Natural Gas Net Imports, 2005 and 2030 (trillion cubic feet) Annual Energy Outlook 2007
U.S. Natural Gas Production by Source, 1990-2030 (trillion cubic feet) History Projections Lower 48 Non-Associated Unconventional Lower 48 Non-Associated Conventional Onshore Lower 48 Non-Associated Offshore Lower 48 Associated-Dissolved Alaska Annual Energy Outlook 2007
Major Sources of Incremental U.S. Natural Gas Supply, 2006-2030 (trillion cubic feet) Growth in Alaskan Production Growth in LNG Imports Growth in Non-Associated Unconventional Base Production (all sources) Annual Energy Outlook 2007
U.S. Unconventional Natural Gas Production, 1990-2030 (trillion cubic feet) History Projections Tight Sands Coalbed Methane Gas Shales Annual Energy Outlook 2007
U.S. Net Imports of Natural Gas, 1990-2030(trillion cubic feet) History Projections Overseas LNG Canada Mexico Annual Energy Outlook 2007
Everett, Massachusetts 3.4 Bcf Storage Capacity Regasification Capacity: Peak: 1.035 Bcf per day Baseload: 715 MMcf per day Cove Point, Maryland 7.8 Bcf Storage Capacity Regasification Capacity: Peak: 1.0 Bcf per day Baseload: 750 MMcf per day Elba Island, Georgia 7.3 Bcf Storage Capacity Regasification Capacity: Peak: 1.2 Bcf per day Baseload: 820 MMcf per day Current U.S. LNG Import Terminals Lake Charles, Louisiana 9.0 Bcf Storage Capacity Regasification Capacity: Peak: 2.1 Bcf per day Baseload: 1.8 Bcf per day Gulf of Mexico, Offshore Gulf Gateway Energy Bridge Regasification Capacity: Peak: 690 MMcf per day Baseload: 500 MMcf per day
U.S. LNG Imports, 1990-2030(trillion cubic feet) History Projections New Terminals Existing Terminals Annual Energy Outlook 2007
U.S. Electricity Generation by Fuel, 1980-2030 (billion kilowatthours) History Projections Coal Natural Gas Nuclear Renewables Petroleum Annual Energy Outlook 2007
U.S. Electricity Generating Capacity, including Combined Heat and Power, 2005-2030 (gigawatts) New Nuclear New Renewable New Coal Needed Capacity New Natural Gas Existing Other Fossil Steam Existing Combustion Turbine Existing Coal Steam Existing Combined-Cycle Existing Renewable Existing Nuclear Existing Pumped Storage Annual Energy Outlook 2007
U.S. Electricity Generation Capacity Additions by Fuel, 2006-2030 (gigawatts) Natural Gas Coal Renewables Nuclear Annual Energy Outlook 2007
Periodic Reports Petroleum Status and Natural Gas Storage Reports, weekly Short-Term Energy Outlook, monthly Annual Energy Outlook 2007, February 2007 International Energy Outlook 2006, June 2006, next release in May 2007 Examples of Special Analyses “Economic Effects of High Oil Prices,” Annual Energy Outlook 2006 Analysis of Oil and Gas Production in the Arctic National Wildlife Refuge, March 2004 The Global Liquefied Natural Gas Market: Status and Outlook, December 2003 “Restricted Natural Gas Supply Case,” Annual Energy Outlook 2005 www.eia.doe.gov Guy F. Caruso guy.caruso@eia.doe.gov
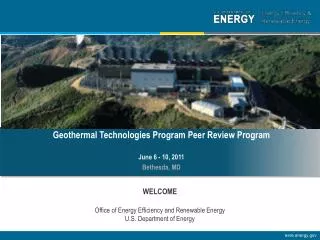
WELCOME TO THE 2007 US-ALGERIA ENERGY FORUM SPONSORED BY