Download
1 / 50
500 likes | 740 Views
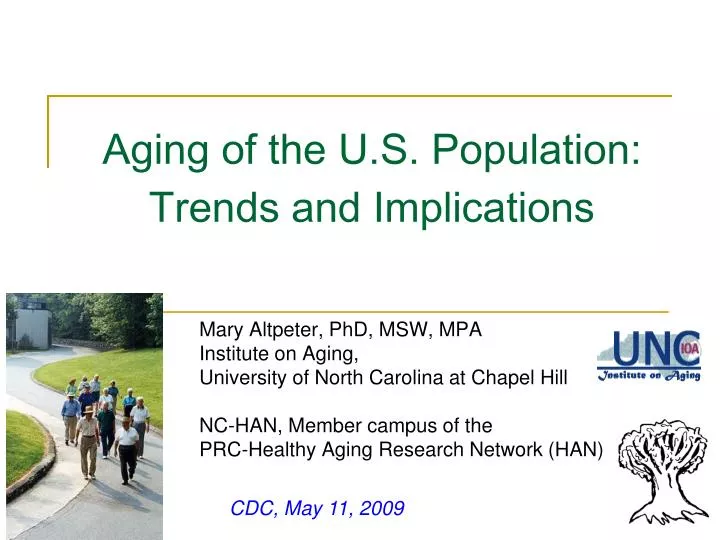
Aging of the U.S. Population: Trends and Implications. Mary Altpeter, PhD, MSW, MPA Institute on Aging, University of North Carolina at Chapel Hill NC-HAN, Member campus of the PRC-Healthy Aging Research Network (HAN). CDC, May 11, 2009. Presentation Overview.

E N D
Aging of the U.S. Population: Trends and Implications Mary Altpeter, PhD, MSW, MPA Institute on Aging, University of North Carolina at Chapel Hill NC-HAN, Member campus of the PRC-Healthy Aging Research Network (HAN) CDC, May 11, 2009
Presentation Overview • The PRC-Healthy Aging Research Network (HAN) approach to healthy aging • Multiple aspects of health and well-being for older adults • The health status and future of Boomers • What’s happening in health promotion and aging • Summing it up: Challenges we face
Sites of the CDC PRC-Healthy Aging Research Network (HAN) University of Washington University of Colorado University of Illinois at Chicago University of Pittsburgh University of California at Berkeley West Virginia University University of North Carolina University of South Carolina Texas A&M University
Activities of the PRC-HAN • Better understand the determinants of healthy aging in older adults • Identify interventions that promote healthy aging • Assist in the translation of such research into sustainable community-based programs throughout the nation
Examples of PRC-HAN Resources Conference Series (Physical Activity, Depression, Environmental and Policy Factors) Written materials such as conference monograph and RE-AIM issue brief On-line modules for Provider Training
Rowe and Kahn Model “Healthy Aging” Managing Chronic Conditions “and injury and promoting health” “optimizing” Source: Marshall, V.M. & Altpeter, M. (2005). Cultivating social work leadership in health promotion and aging: Strategies for active aging interventions. Health&Social Work, 30(2), 135-144.
PRC-HAN Definition of Healthy Aging Healthy aging is the development and maintenance of optimal physical, mental and social well-being and function in older adults. It is most likely to be achieved by • individualswho live in • physical environments and communities that are safe and support the adoption and maintenance of attitudes and behaviors known to promote health and well-being; • the effective use of health services to prevent or minimize the impact of acute and chronic disease on function CDC-funded PRC Healthy Aging Research Network http://depts.washington.edu/harn/
Multiple aspects of older adult health and well-being • Population trends • Marital status • Health literacy, internet use • Wealth • Workforce participation • Volunteerism • Caregiving
70 million Life expectancy = 77 years 35 million 21million Life expectancy = 47 years 3 million 4.2 million
Living to 100Number of Centenarians in the U.S. 17 % of all seniors 10% of all seniors Source of data: US Census Bureau, Current Populations Reports, P23-199RV, July 1999
Computer and Internet Use in the United States: 2003 Source: US Census Bureau, 2005
Past and Projected Number of Workers Over Age 55, 1970-2025 Source: US Census Bureau, 2008; GAO Report to the Ranking Minority Member, Subcommittee on Employer-Employee Relations, Committee on Education and the Workforce, House of Representatives, Nov. 2001
2005 Average – $196,000 Whites – $226,900 Blacks – $37,800 1984 Average – $109,900 Whites – $125,000 Blacks – $28,200 Change in Median Net Worth of 65+ Households: 1984 - 2005 79% 81% 34% Source: Older Americans 2008, Key Indicators of Well-Being
Poverty Rate by Age, U.S. (2007) Source: Statehealthfacts.org, retrieved 4/15/09
Factors in the Decision to Work in Retirement (%) Source: S. Kathi Brown, "Staying Ahead of the Curve 2003: The AARP Working in Retirement Study," Washington, DC: AARP, 2003*Respondents could choose as many factors as apply to them
Older Adults as Volunteers Source: U.S. Bureau of Labor Statistics, Volunteering in the United States, 2008
Grandchildren in Grandparents’ Homes Where Grandparents are the Householders Source: US Census Bureau, Current Population Survey, March and Annual Socieconomic Supplements, 2008 and earlier. http://www.census.gov/population/socdemo/hh-fam/ch7.xls
Value and Cost of Informal Caregiving • 12.8 million Americans need care • 7.3 million are 65 and older • The value of informal caregiving is estimated at $196 billion per year • Informal caregiving exceeds nursing home and home care expenses by $81 billion • Caregiving costs U.S. businesses $11.4 billion annually • Caregivers lose up to $659,139 over a lifetime Geriatric Social Work Initiative, San Jose State University, College of SocialWork
$245 billionan average of $1,066 per person 1980 $1.4 trillionan average of $5,039 per person 2001 $2.8 trillionan average of $9,216 per person 2011 Chronic diseases account for75%of the $1.4 trillion we spend on health care Mensah: www.nga.org/Files/ppt/0412academyMensah.ppt#21 Heffler et al. Health Affairs, March/April 2002.
Boomers will be living longer: % people age 65 who will live to age 90 Four-fold increase 2050 1940 1960 1980 2000 Source of data: US Census Bureau
Boomers are relatively wealthier but are also worried about future health care costs • Wealthy - possess ¾ of nation’s financial assets + estimated $1trillion in annual disposable income • Yet, 44% those 55-59 fearful of not having sufficient resources to live beyond age 85 “When I’m 64: How Boomers Will Change Health Care ”, American Hospital Association, May 2007
Boomers provide a substantial amount of caregiving • >70% have at least one living parent • 25 million live with an aging parent • 13 million provide parental caregiving “When I’m 64: How Boomers Will Change Health Care ”, American Hospital Association, May 2007
What’s the health picture for Boomers? By 2030 • More than 6 of every 10 will be managing more than one chronic condition • 14 million (1 out of 4) will be living with diabetes • >21 million (1 out of 3) will be considered obese • Their health care will cost Medicare 34% more than others • 26 million (1 out of 2) will have arthritis • Knee replacement surgeries will increase 800% by 2030 “When I’m 64: How Boomers Will Change Health Care ”, American Hospital Association, May 2007
What’s the health care picture for Boomers? Cause significant shift in health care: • By 2020, Boomers will make 40% of all physician office visits • By 2030 hospital admissions among Boomers will increase more than 100%, totaling half of all admissions in the US “When I’m 64: How Boomers Will Change Health Care ”, American Hospital Association, May 2007
NCOA Survey Key Findings • Americans 44 and older with chronic conditions are diverse • One in four has delayed health care due to cost • Most rely on health care system for help, but it’s not working well for many • Many are not getting help and support they need • Cost, confidence, lack of knowledge are barriers to managing conditions Source: Re-forming Healthcare: Americans Speak Out About Chronic Conditions & the Pursuit of Healthier Lives, NCOA, March 2009
Types of support NCOA survey respondents identified: • 71% - Learn how to exercise or eat better in a way that is realistic and works with your limitations • 68% - Get practical tips and advice from other people who have health problems similar to yours • 59% - Set goals and work together with other people who are trying to improve their health • 58% - Learn how to manage work, family and other responsibilities and still take care of your health Source: Re-forming Healthcare: Americans Speak Out About Chronic Conditions & the Pursuit of Healthier Lives, NCOA, March 2009
The prevention imperative Only 30% of physical aging is attributable to genetic heritage! Prevention – it’s for EVERYONE! Slide from Becky Hunter, UNC CAH
Threats to Health Among Seniors • 73% age 65 - 74 report no regular physical activity • 81% age 75+ report no regular physical activity • 61% - unhealthy weight • ~35% - fall each year • 20% - clinically significant depression; age group at highest risk for suicide • 32% - no flu shot in past 12 months • 35% - never had pneumococcal vaccine • 20% - prescribed “unsuitable” medications • Also at greatest risk for fire-related injuries, and traumatic brain injury (age 75+) Sources: State of Aging and Health, 2007; www.cdc.gov/nchs; www.cdc.gov/ncipc/olderadults.htm
Health promotion and disease prevention does work for older adults • Longer life • Reduced disability • Later onset • Fewer years of disability prior to death • Fewer falls • Improved mental health • Positive effect on depressive symptoms, social connectedness • Delays in loss of cognitive function • Lower health care costs www.healthyagingprograms.org/content.asp?sectionid=85&ElementID=304
Ideal Survivorship Curve: The “rectangularization” of morbidity Source: J.F. Fries and L.M. Crapo, Vitality and Aging (San Francisco:W.H. Freeman, 1981).
National level partnerships for health promotion advocacy: A growing list… • Centers for Disease Control and Prevention • Administration on Aging • Centers for Medicare and Medicaid Services • Agency for Healthcare Research and Quality • Environmental Protection Agency • Robert Wood Johnson Foundation • Archstone Foundation • John A. Hartford Foundation • Atlantic Philanthropies • National Council on Aging • American Society on Aging • National Association of State Units on Aging • National Association of Area Agencies on Aging • National Association of Chronic Disease Directors • “Disease-specific” Associations
Some common approaches used in health promotion and aging • Socio-ecological theory • Chronic Care Model • RE-AIM Framework
The Social-Ecological Perspective • The health and well-being of older adults will be improved only if we work from a broad perspective. • Comprehensive planning and partnerships at all levels are required. • Changes at the individual level will come with improvements at the organizational, community and policy levels. Adapted: Prevention: Why Does It Matter? PowerPoint presentation by Nancy Whitelaw, March 2007, available at: www.healthyagingprograms.org
Self-management support Community resources Organization of health care Interdisciplinary teams Decision support Clinical information systems Chronic Care Model
RE-AIM framework • Analyze epidemiological data to target health issues and populations • Develop common core of practical process and outcome measures • Build partnerships across multiple sectors • Implement evidence-based health promotion programs with fidelity • Maintain individual-level benefits and sustain ongoing programming
A short list of evidence-based health promotion programs for older adults • Chronic Disease Self-management Program • Diabetes Self-Management • Active Living Every Day • Active Options • Enhance Wellness/Enhance Fitness • Matter of Balance • Fit and Strong • AF Exercise Program • AF Aquatics Program • Arthritis Self-Help Program • Fit and Strong • Healthy IDEAS • PEARLS
What the data tell us • Older adult population is the fastest growing sector of the overall population and older adults are becoming more racially and ethnically diverse. • Increased demand for tailored programming for reaching oldest old and minority elders • Race, class and gender compound aging effects, resulting in higher risks for health, poverty and other social problems. • Health literacy is an issue for a significant portion of the boomer and older adult populations
What the data tell us (continued) • The majority of older adults report good health and many are able to work and contribute to family and society • Cost related to health care are growing out of control • Exponentially higher expenditures for health care and services • “Costs” to caregivers is staggering • direct out-of-pocket expenses, economic insecurity caused by changes in work patterns, and health effects • Unprecedented demand by older adults and boomers for • caregiving and other support services • long term care solutions • health promotion/disease prevention, falls prevention and chronic care programs
Challenges confronting health promotion and disease prevention for older adults • Science not shared – growing body of evidence of interventions that can positively impact health, disability and quality of life • Fragmented systems and services across aging, medical care, mental health and public health • Untapped assets of 29,000 organizations currently reaching 7-10 million older adults • Lack of common conceptual “language” • Much work to be done in expanding the evidence base in health promotion/disease prevention and chronic disease self-management for diverse older populations Adapted: Prevention: Why Does It Matter? PowerPoint presentation by Nancy Whitelaw, March 2007, available at: www.healthyagingprograms.org
Challenges (cont’d) • Untapped creative approaches to reaching older adults, e.g., through worksites, libraries, grandparent groups and intergenerational programming • Under-developed health information technology to help older adults and boomers manage their conditions and participate in health promotion, falls prevention and chronic disease self-management programming • Under-developed mechanisms to tap into and train boomer and older adult populations as valuable resources in delivering health promotion programs
The message for all us • It’s never too late to start and it’s always too early to quit • But, it’s also never too early to start - life course perspective • Think “immediate” – those currently 65+ • Think “intermediate” – those 35-64 • Think “long-range” – children Adapted from: Robert Butler, “Maintaining Healthy Lifestyles,” International Longevity Center, 2000 and “Reimagining America: AARP’s Blueprint for the Future”, 2005
Thank You! Mary Altpeter UNC Institute on Aging Mary_Altpeter@unc.edu