Download
1 / 18
180 likes | 329 Views
Modeling Risk Adjusted Capitation Rates in Regione Umbria. Elaine Yuen, PhD; Daniel Z. Louis, MS; Paolo DiLoreto; Joseph S. Gonnella, MD American Public Health Association Meeting October 22, 2001.

E N D
Modeling Risk Adjusted Capitation Rates in Regione Umbria Elaine Yuen, PhD; Daniel Z. Louis, MS; Paolo DiLoreto; Joseph S. Gonnella, MD American Public Health Association Meeting October 22, 2001 Thomas Jefferson Center for Research Jefferson Medical in Medical Education University College and Health Care
Project Overview • Purpose: to risk adjust per capita reimbursement rates • Age sex adjustment • Severity of illness adjustment • Three major tasks: • Collection and compilation of data from Regione Umbria • Risk adjustment using US Medicare PIP-DCGs • Risk adjustment using Disease Staging
Description of Study Database • Data from Regione Umbria, 1997-1998 • Hospital data • day and ordinary admissions • DRGs and DRG based tariffs • clinical and demographic information • Umbria residents hospitalized in Umbria and other regions • Pharmacy data • individual prescription level • captured drug codes, tariffs and co-pays • Demographic file • age, sex, USL
Disease Staging • Clinically-based patient classification system • Over 400 disease categories • Based upon disease etiology, organ involvement, and severity of comorbidity. • Computerized algorithm uses ICD-9-CM codes • Severity of illness stages: • Stage 1, conditions with no complications or problems of minimal severity • Stage 2, problems limited to an organ or system, with significantly increased risk of complications • Stage 3, diseases with multiple site involvement, generalized systemic involvement, and/or poor prognosis
Use of Staging for Severity Adjustment • All admissions were aggregated by Disease Staging category and severity stage • Reviewed by clinicians for propensity of affecting future year resource use • Excluded clinical categories • Acute illnesses that can be cured, e.g. Stage 1 Appendicitis • Vague signs/symptoms with no etiology at Stage 1 or 2 • Chronic diseases that were cured, e.g. Stage 1 Cholecystitis after cholecystectomy
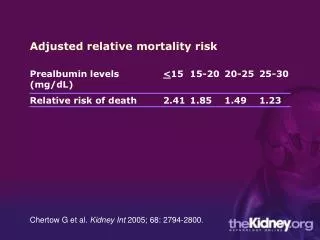
Use of Staging for Severity Adjustment (continued) • Included clinical categories • All Cancers (except basal cell) • All stages of Central Nervous System, Cardiovascular, and Respiratory Diseases • Stage 2 and 3 of Gastrointestinal, Hemapoetic, Renal, and Endocrine • HIV/AIDs • Impact on future year tariffs of included cases were • Minimum • Moderate • Severe
Descriptive Statistics • Used clinical and demographic information, 1997 Test database • Aggregated admissions if there were less than 50 cases in any one category • Considered 155 unique clinical categories within 5 larger categories • Cancer, HIV, Minimum, Moderate, Severe • Collapsed admissions into person-level file and merged with demographic data • Test database (N=411,539 persons) • 87.21% (N=358,893) were not hospitalized in 1997 • 7.51% (N=30,908) were excluded from our severity categories • 5.28% (N=21,738) persons were considered in the models
Included and Excluded Severity CategoriesTest Database, Regione Umbria
Risk Adjustment Models Predicting 1998 Tariffs • Models were built at the individual person level • Used a split sample • One part of the data was used for modeling • The other part for the testing of model • TOTAL COSTS in 1998 = f (clinical categories in 1997 + age/gender cohorts + error) • 22 age-sex cohorts • Disease Staging - 133 clinical categories in 1997 • PIP-DCGs - 15 PIP-DCGs in 1997
Limitations • Case finding: • Uses hospitalization data to identify a person’s severity of illness • Persons who are ill but may not be hospitalized are not captured (for example, someone with diabetes who uses only outpatient care) • Uses only hospitalization and pharmaceutical data to calculate tariffs • Ideally would calculate all costs of medical care • Use of GP and/or outpatient services may vary by condition
Where do we go from here? • Refine model • Outpatient or GP data included in year 2 costs • Separate models for hospital and pharmacy tariffs • Re-run with more recent data • Re-calibrate Disease Staging groupings • Improve case finding, possibly using pharmaceutical data • Estimate impact • On USL or distretto within the region • For different demographic cohorts