Download

1 / 19
340 likes | 1.05k Views
POPULATION FORECASTING - Logistic CURVE METHOD. GROUP MEMBERS. Kush Poorunsing Aman Sahadeo Arshaad Jeedaran Nevin Sunassee Pamben Moonsamy Kishan Joorawon. Population Forecasting. Important process in the design of waste water treatment plants

E N D
POPULATION FORECASTING - Logistic CURVE METHOD
GROUP MEMBERS Kush Poorunsing AmanSahadeo ArshaadJeedaran NevinSunassee PambenMoonsamy KishanJoorawon
Population Forecasting • Important process in the design of waste water treatment plants • Factors affecting change in population: • Fertility/ Birth rate • Death rate • Migration
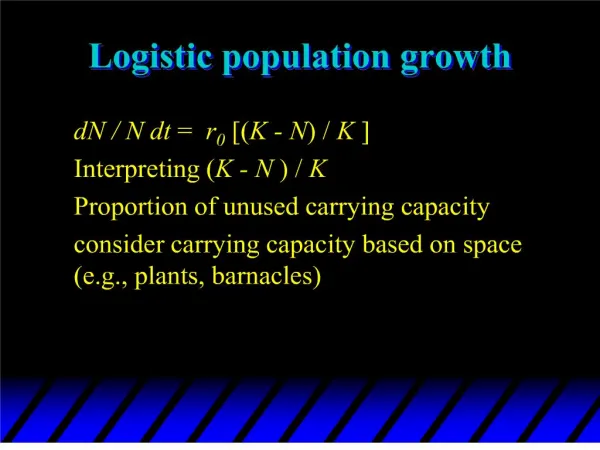
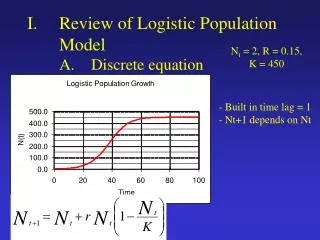
Logistic Method Saturation population • Follows some logical mathematical relationship. • has an S-shape combining a geometric rate of growth at low population with a declining growth rate as the population approaches some limiting value.
Equation - 1 • ………………. (1) • Where Pt: population at some time in the future Psat: population at saturation level t: number of years after base year a, b: data constants
Equation - 2 • ……………….. (2) • Where Psat: population at saturation level Po: base population P1, P2: population at time periods
Equation - 3 • …………………. (3) • ………………(4) • Where n: time interval between successive censuses
Example • The data for population censuses from 1851 to 2000 for Island of Rodrigues is given below. Estimate the expected population in 2011.
STEP 1 • Three successive years, represented by to, t1, and t2are chosen such that they are equidistant from each other. t0 t1 t2
STEP 2 • The number of years from toto t1and t1 to t2 is denoted by n. t0 n=28 t1 n=28 t2
STEP 3 • The population figures corresponding to to, t1, and t2are Po, P1and P2respectivelythrough which the logistic curve is to pass. t0 P0 n=28 t1 P1 n=28 P2 t2
CALCULATIONS - 1 • n=28 • P0= 11885, P1= 24769 and P2= 35779 • From equation 2, • ∴
CALCULATIONS - 2 • From equation 3, • ∴ • From equation 4, • ∴
CALCULATIONS - 3 • Replacing the values obtained in equation 1, the expected population for 2011 is: • = 2011-1944 = 67 years
CONCLUSION • Based on census reports, the population of Rodrigues in 2011 was 37,922 (Wikipedia) • Estimated population with logistic method is 38420.8 • 1.31% deviation from actual value
Advantages and Disadvantages • Advantages • Longer projection period compared to simple geometric procedures • Gives a better approximation than other methods. • Disadvantages • Mechanical process • Cannot predict decreasing population • Demographic and socioeconomic changes not considered • Requires a large number of observations covering a long period
References • Punmia, B.C, Arun, K.J., 2005. Water Supply Engineering. 2nd ed. New Delhi: Laxmi Publications • Annual Digest of Statistics 2011 [Online]. Available from: http://www.gov.mu/portal/goc/cso/file/AnnualDigestofStatistics2011.pdf • Rodrigues [Online]. Available from: http://en.wikipedia.org/wiki/Rodrigues